![]()
Zenabis Announces Third Quarter 2020 Financial Results
- Q3 2020 net revenue from the Cannabis segment increased 61% to $19.0 million from $11.8 million in Q2 2020
- Q3 2020 kilograms of cannabis sold increased 98% to 7,819 kg from Q2 2020
- Q3 2020 Adjusted EBITDA of $3.5 million; third consecutive positive quarter
- Q3 2020 consolidated net revenue of $23.7 million compared to $12.0 million in Q3 2019
VANCOUVER, BC, Nov. 13, 2020 /CNW/ – Zenabis Global Inc. (TSX: ZENA) (“Zenabis” or the “Company”) today announced its financial results for the third quarter ended September 30, 2020. All amounts, unless specified otherwise, are expressed in Canadian dollars.
We are pleased to report that Zenabis continues to grow its cannabis revenue, with significant 61% quarter-over-quarter growth in this segment. This increase reflects the impact of new Cannabis 2.0 products launched in the quarter, growth in our international bulk channels, and continuing market share growth in the Canadian recreational market.
 Shai Altman, Chief Executive Officer of Zenabis
“Adjusted EBITDA for the quarter was positive for the third consecutive quarter at $3.5 million, compared to $3.4 million in Q2 2020; the seasonal, $2.6 million decrease in the Propagation segment was offset by Adjusted EBITDA in the Cannabis segment increasing 141% or $2.2 million over Q2 2020 as a result of increased revenue, and a $450 thousand improvement in the Other segment as a result of cost containment. The Company continued to improve its balance sheet in the quarter with $7.6 million raised in September’s unit offering, with the proceeds used to repay debt and for the Company’s continuing growth. The Company expects revenue in the Cannabis segment to continue to grow by up to 10% in the fourth quarter of the year. Growth continues to be driven by increased consumer demand for, and distribution of, our products in the Canadian recreational channel resulting from a combination of our high product quality, competitive pricing, and growth in demand for our Cannabis 2.0 products. Based on this revenue estimate, Zenabis expects to record consolidated Adjusted EBITDA of $5 million to $7 million in Q4 2020.”
Third Quarter 2020 Highlighted Financial Results
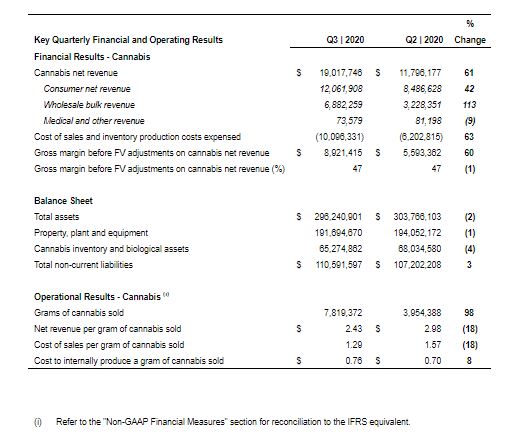
- Cannabis segment net revenue increased 61.2% to $19.0 million from $11.8 million in Q2 2020;
- Propagation segment net revenue increased to $4.7 million from $4.4 million in Q3 2019, the relevant comparator given seasonality in this segment, while falling from $15.6 million in Q2 2020, in line with historical segment seasonality;
- Resulting consolidated net revenue for Q3 2020 totaled $23.7 million, compared to $27.4 million in the prior quarter;
- Gross Margin before fair value changes to biological assets and inventories for the cannabis segment was $8.9 million or 46.9% of net revenue in Q3 2020, compared to $5.6 million or 47.4% of net revenue in Q2 2020, an increase of 59%;
- Net revenue per gram of cannabis sold in the quarter was $2.43 compared to $2.98 in the previous quarter, reflecting the impact of significant growth in the Company’s wholesale bulk channel. Wholesale bulk sales are typically at lower selling prices than consumer sales but generate higher margins due to lower fulfillment and packaging costs;
- Cost of goods sold per gram of cannabis sold in the quarter was $1.29 compared to $1.57 in the previous quarter;
- Cost to internally produce a gram of cannabis sold was $0.76 compared to $0.70 last quarter;
- Consolidated Adjusted EBITDA for the quarter totaled $3.5 million, compared to $3.4 million last quarter, reflecting a substantial improvement in the Cannabis segment due to increasing revenue, offset by a seasonal decrease in the Propagation segment. Consolidated Adjusted EBITDA was marginally lower than the Company’s guidance for the quarter as a result of slightly higher operating costs than expected to support the Company’s continuing growth; and
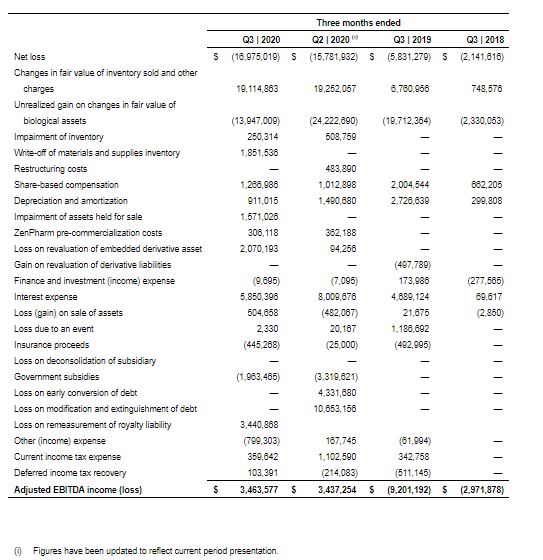
- Consolidated net loss for Q3 2020 totaled $17.0 million or $0.03 per share, fully diluted, compared to $15.7 million or $0.04 per share, fully diluted, in Q2 2020. This consolidated net loss included a significant number of non-recurring and non-cash components, including:
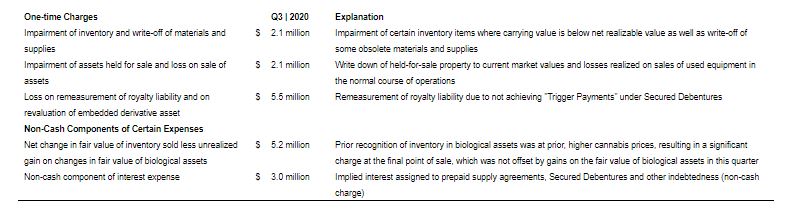
- Eric Rasmussen, Chief Financial Officer of Zenabis, added, “Significant one-time charges related to financial transactions as well as recognition of changes in the marketable price of cannabis and certain goods led to a net loss in Q3 2020. However, with Consolidated Adjusted EBITDA greater than cash interest expenses for the quarter, and strong forecast growth in cashflow from operations, the Company is now in a significantly stronger financial position.”
Third Quarter Developments
- The Company entered into a purchase agreement with Canveda Inc. to supply a minimum of 300 kg and a maximum of 1,000 kg of cannabis flower per quarter; and
- The Company completed a $7.6 million equity marketed offering in September 2020, with proceeds primarily used to prepay and repay certain near-maturity debt.
Selected Financial Data
The following selected financial data with respect to the Company’s financial condition and results of operations have been derived from the Consolidated Financial Statements of the Company for the three months ended September 30, 2020 and June 30, 2020, prepared in accordance with IFRS. The selected financial data should be read in conjunction with the Consolidated Financial Statements.
Summary Third Quarter 2020 Financial Results
Cannabis Segment
Net revenue increased to $19,017,746 and $43,415,039 during the three and nine months ended Q3 2020, respectively, compared to $7,086,258 and $18,437,092 during the respective periods in the prior year due to increased sales to provincial customers and the continued shipments of bulk cannabis to other LPs. Net revenue during the three months ended September 30, 2020 increased by 61% from $11,796,177 during the three months ended June 30, 2020 as a result of increased recreation sales volume and increase bulk sales in the quarter.
Cost of sales and inventory production costs expensed increased to $10,096,331 and $23,894,234 during the three and nine months ended September 30, 2020, respectively, compared to $3,462,998 and $9,130,527 during the respective periods in the prior year due to increased sales. Cost of sales and inventory production costs expensed during the three months ended September 30, 2020 increased by 63% from $6,202,815 during the three months ended June 30, 2020 due to higher sales.
Operating income for the segment decreased to $(7,043,047) and increased to $953,438, respectively for the three and nine months ending September 30, 2020, compared to operating losses of $3,049,147 and $6,433,669 for the corresponding periods of 2019. The decrease for the three months ended is due to certain one-time costs incurred at the facilities and non-cash, the significant improvement in operating income for the nine months ended is the result of higher sales volumes and cost cutting measures implemented by the Company.
Propagation Segment
Net revenue, excluding inter-segment amounts, increased to $4,704,636 and decreased to $27,577,412 during the three and nine months ended September 30, 2020, respectively, compared to $4,493,893 and $29,078,148 during the respective periods in the prior year due to the effects of the COVID-19 pandemic, resulting in changing trends in the demand for flower and vegetable products.
The remaining gross margin components, being cost of sales and inventory production costs expensed, realized fair value amounts included in inventory sold, and unrealized gain on changes in fair value of biological assets should be analyzed together for the Propagation segment due to the quick turn-over of plants in the Propagation segment and the short growing period. These component totals increased to $3,327,167 and decreased to $19,272,754 during the three and nine months ended September 30, 2020, respectively, compared to $3,020,732 and $21,300,943 during the respective periods in the prior year due to changes trends in demand and sales as a result of COVID-19.
Operating income for the segment decreased to $445,645 and increased to $6,710,269, respectively, for the three and nine months ended September 30, 2020 compared to $709,350 and $4,708,702 for the corresponding periods of 2019. The improvement in operating income is the combined result of improved margins realized in 2020 in comparison to 2019 as well as operational cost reductions.
Outlook
Considering the factors described below and based on quarter-to-date (unaudited) results, Zenabis anticipates recording consolidated net revenue in Q4 2020 in the range of $25-29 million, comprised of $19-21 million for the Cannabis segment and $6-8 million for the Propagation segment. The Company anticipates recording consolidated Adjusted EBITDA in the range of $5-7 million for Q4 2020.
Operational outlook
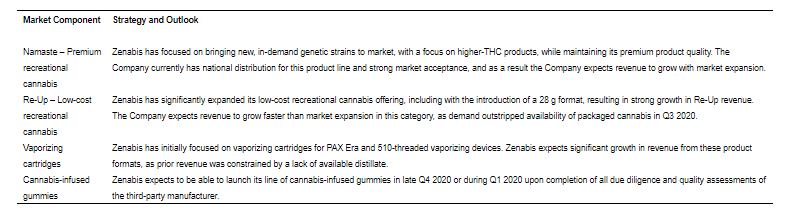
Zenabis believes that the Canadian recreational market is positioned for continued growth over the remainder of 2020 and through 2021 as a result of additional retail store openings planned for Ontario, British Columbia and other provinces. Additionally, the Company also expects the increasing availability of edible and derivative products to significantly expand the Canadian adult-use recreational market.
Zenabis continues to focus on achieving and maintaining operational excellence in 2020, and will maintain this focus through 2021. The Company has implemented various initiatives that have resulted in positive Adjusted EBITDA, significant growth in net revenue, expansion of overall market share, strengthening brand, and growth in consumer demand. To continue these positive advances, Zenabis maintains a consistent and active review of our operational processes, focusing on continually driving down costs, optimizing procedures and expenditures in our supply chain, and continuing to work closely with our customers to ensure our production is optimized to the market demands.
Financial outlook
Over the course of 2020, the Company has reduced total debt outstanding by more than $50 million through debt conversions and early repayments, while at the same time extending the majority of its remaining debt outstanding. The various steps taken in relation to the Company’s debt has significantly reduced near-term maturities and maintained working capital availability through the ramp-up of Adjusted EBITDA. The below table provides current principal outstanding as of this date, together with estimated quarterly interest payments:
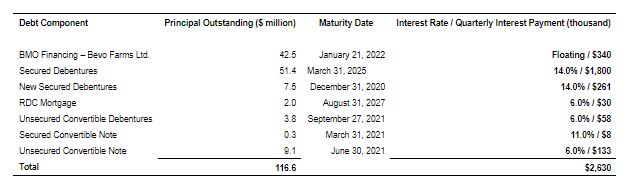
Consolidated Adjusted EBITDA for both Q3 2020, and for the forecast Q4 2020 period, are significantly greater than forecast ongoing interest expense.
Non-GAAP Financial Measures
ADJUSTED EBITDA
Adjusted EBITDA is not a recognized, defined, or standardized measure under IFRS and may not be compared to similar measures presented by other issuers. Adjusted EBITDA is a metric used by management, calculated as net loss before fair value adjustment to inventory and biological assets; impairment of inventory; write-off of materials and supplies inventory; restructuring costs; share-based compensation; depreciation and amortization; impairment of assets held for sale; ZenPharm pre-commercialization costs; loss on revaluation of embedded derivative asset; loss (gain) on revaluation of derivative liabilities; finance and investment (income) expense; interest expense; (gain) loss on sale of property, plant and equipment; loss due to an event; insurance proceeds; loss on deconsolidation of subsidiary; government subsidies; loss on early conversion of debt; loss on extinguishment of debt; loss on remeasurement of royalty liability; other expense; current income tax expense; and deferred income tax (recovery) expense. Management believes adjusted EBITDA is a useful financial metric to assess the Company’s operating performance before the impact of non-cash items and acquisition related activities. The following is a reconciliation of adjusted EBITDA to net loss, being the closest GAAP financial measure, for the periods outlined:
About Zenabis
Zenabis is a significant Canadian licensed cultivator of medical and recreational cannabis, and a propagator and cultivator of floral and vegetable products. Zenabis employs staff coast-to-coast, across facilities in Atholville, New Brunswick; Aldergrove, Pitt Meadows and Langley, British Columbia; and Stellarton, Nova Scotia. Zenabis currently has 111,200 kg of licensed cannabis cultivation space across four licensed facilities. Zenabis has 3.5 million square feet of total facility space dedicated to a mix of cannabis production and cultivation and its propagation and floral business.
Zenabis expects Zenabis Stellarton, as Zenabis’ centre of excellence for Cannabis 2.0 products, to join Zenabis Atholville and Zenabis Langley in steady state production by the end of 2020. The Zenabis brand name is used in the cannabis medical market, the Namaste, Blazery, and Re-Up brand names are used in the cannabis adult-use recreational market.