A Detailed Look at Cannabis Sales in California, Oregon, Arizona, Colorado, Nevada and Maryland
We are pleased to share with our readers overviews on five important Western cannabis markets as well as Maryland compiled by BDS Analytics for the month of September. BDS Analytics offers a full understanding of the evolving cannabis market though several offerings, including its GreenEdge Retail Sales Tracking, Consumer Insights, Industry Intelligence and CBD Market Monitor divisions. For those not familiar with the Colorado-based company, which was founded in 2015 and is run by co-founders CEO Roy Bingham and President Liz Stahura, we have been covering their progress since almost day 1.
During September, the first month after the onset of the vaping crisis, sales across the six markets totaled $616.6 million, down seasonally from August. Sales growth from a year ago among the five Western markets ranged from 8% in California to as high as 35% in Arizona. Concentrates, which represented 23-33% of sales by market (compared to 26-38% in August), grew more slowly within each market than overall sales grew due to reduced sales of vape pens. Still, each market experienced concentrate sales growth compared to a year ago, ranging from 2% in California to 25% in Arizona.
Here is a closer look at each market, as detailed by BDS Analytics:
California
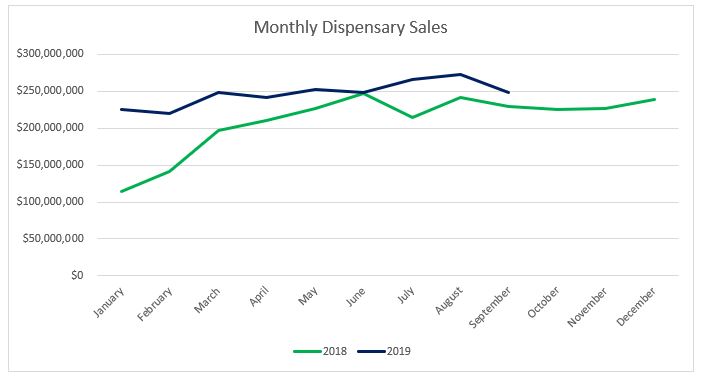
This past September, sales for California’s licensed dispensaries and delivery services reached a combined $248.3 million, decreasing nine percent from August. September is typically a period of seasonal declines from peak Summer demand, but this year’s decline was aggravated by falling vape sales resulting from the public health scare. Year-over-year sales for the month of September show an increase of eight percent, and the combined year-to-date sales of nearly $2.2 billion indicate 22 percent growth compared to 2018.
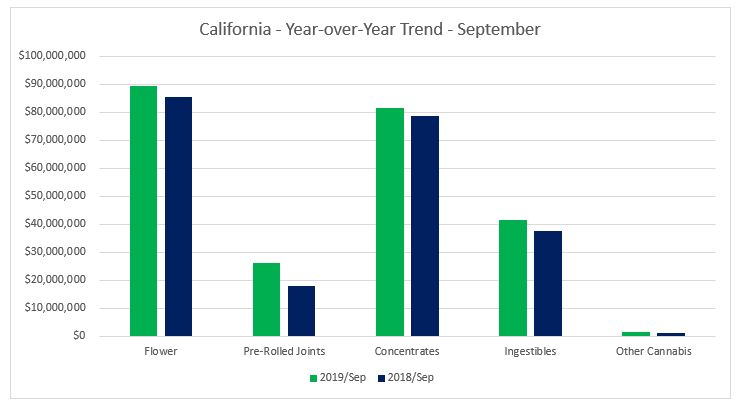
In September, Flower contributed over 36 percent towards overall revenues with $89.5 million in sales. Compared to August, sales in the category decreased two percent; compared to September 2018, sales increased five percent. Year-to-date through September, sales of Flower have reached $745.5 million, a six percent increase compared to the same time period in 2018. Contributing nearly 11 percent towards overall revenue in California, Pre-Rolled Joints sales generated $26.3 million this past September, a 47 percent increase compared to September of 2018. Year-to-date through September, sales of Pre-Rolled Joints have increased 43 percent, reaching just over $200 million.
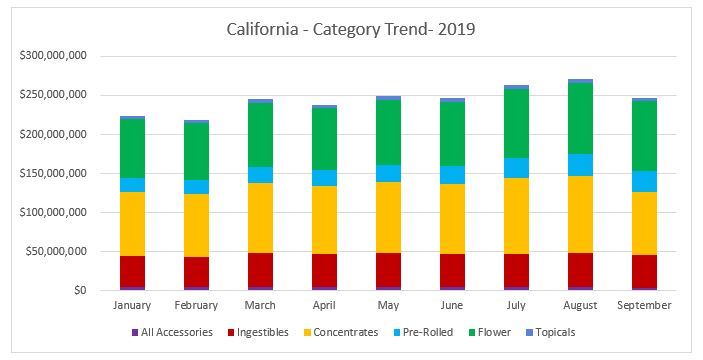
Sales of Concentrates contributed nearly 33 percent of revenues for the month of September. A decline from past months when concentrates were a larger category than flower. The $81.4 million in Concentrates sales represented a decrease of 18 percent from the trailing month, but more than three percent growth compared to September 2018. Year-to-date through September, Concentrates dollar sales increased by over 34 percent compared to the same time period in 2018, reaching $799 million.
Vape sales suffered a 20 percent decline from the trailing month as a result of health and safety concerns. Despite the significant decline, compared to the previous September, sales in the vape category increased by nearly two percent. The vape segment has contributed 83 percent of all concentrate revenues for the year-to-date and 81 percent for the September reporting period.
Sales of Ingestibles reached $41.6 million this past September, contributing 17 percent towards overall revenues. Compared to September 2018, sales in the category increased by 11 percent. Year-to-date revenues indicate an overall growth of 29 percent compared to the same time period in 2018, reaching $375 million. The Ingestibles category includes both Edibles and Sublinguals, while also distinguishing the two subcategories. Compared to September of 2018, revenues from Edibles increased by 13 percent while Sublinguals increased by four percent.
 Oregon
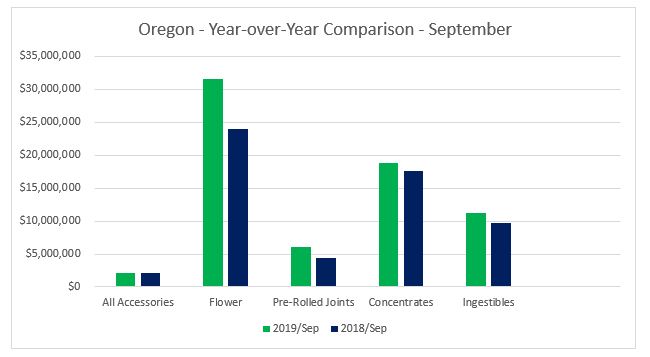
Oregon dispensary sales reached $70.9 million this past September, a ten percent decrease from August. Compared to September 2018, sales increased by 20 percent. Year-to-date through September, sales have also increased by 20 percent compared to the same period in 2018, reaching about $596.5 million.

Flower sales reached $31.6 million in September 2019, accounting for 45 percent of overall revenues. Compared to the trailing month, a five percent decrease in flower revenues outperformed sales from most other major categories. Compared to the prior September, sales of flower have increased by 31 percent. Year-to-date through September, Flower sales have increased 17 percent compared to 2018, reaching $246 million. The $6 million generated from Pre-Rolled Joints in September 2019 contributed nearly nine percent towards overall revenues for the month. Compared to September 2018, sales increased 36 percent. Year-to-date through September, sales in the category grew almost 17 percent compared to the year prior.
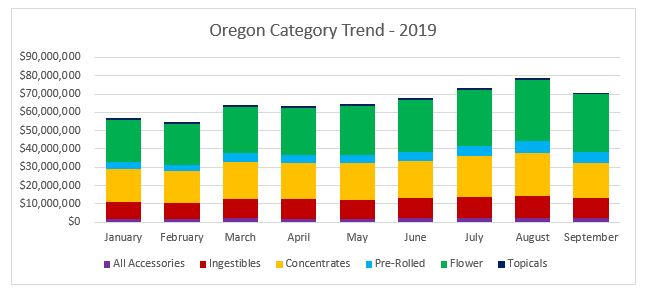
Sales within the Concentrates category contributed nearly 27 percent towards September total revenues. The $18.8 million in Concentrates sales was a seven percent increase from the previous September but was a 20 percent decline from the trailing month. Compared to August, vape sales dropped 28 percent in September. In the first nine months of 2019, Concentrates sales have increased 27 percent over the same period in 2018, reaching $179.8 million.
Sales of Ingestibles generated $11.2 million in September and contributed 16 percent towards revenues for the month. Year-over-year sales in September increased by 15 percent. Year-to-date, the $95.5 million in Ingestibles sales represented 19 percent growth compared to the same period in 2018. The Ingestibles category includes both the Edibles and Sublinguals subcategories. Edibles sales contributed 77 percent towards Ingestibles revenues for the month of September. Year-to-date, sales of Edibles have increased 17 percent and sales of Sublinguals have increased 35 percent over the prior year.
 Arizona
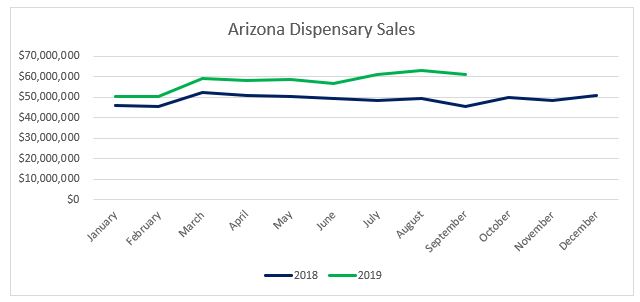
Sales for Arizona’s medical dispensaries were $61.4 million this past September, a three percent decrease from August. Compared to September 2018, sales increased over 35 percent. Year-to-date through September, sales have reached $519.2 million, an $80.2 million increase from the same period last year.
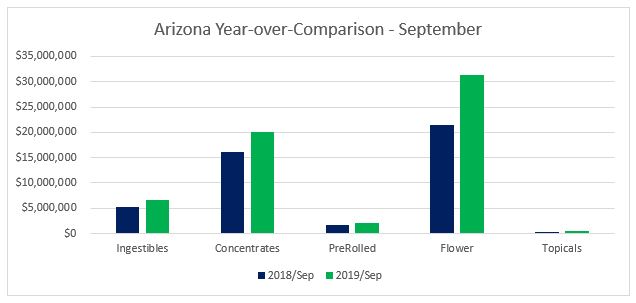
In September, Flower sales reached $31.4 million, accounting for nearly 51 percent of overall revenues for the month. Flower sales increased by two percent from the trailing month and 47 percent from the year prior. Year-to-date, Flower sales have increased 19 percent, reaching $243.1 million.
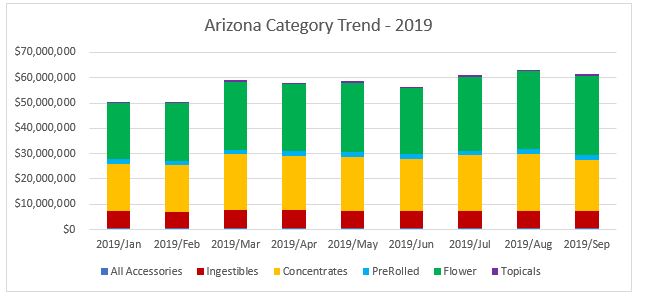
Pre-Rolled Joints remain a small category in Arizona’s medical-only market. Sales of Pre-Rolled Joints were $2.1 million in September and $17.3 million in year-to-date through September. Compared to 2018, sales for the month increased 31 percent and year-to-date sales increased eight percent. In the most recent reporting period, the category contributed three percent towards overall revenues.
The Concentrates product category accounted for 33 percent towards overall revenues in September. The $20.2 million in Concentrates sales represented 25 percent growth compared to September 2018. Year-to-date through September, sales of concentrates have increased 18 percent compared to the same period last year, reaching $186.4 million. Vape products are the largest segment within concentrates, compared to the previous September vape sales increased 25 percent but compared to the trailing month revenues from vape decreased 14 percent.
Sales of Ingestibles generated $6.6 million in September 2019 and contributed 11 percent towards total revenues for the month. Compared to September 2018, sales increased 25 percent. Year-to-date, the $60.9 million sold in Ingestibles was 23 percent greater compared to the same period in 2018. The Ingestibles category includes both Edibles and Sublinguals. Edibles sales contributed 87 percent towards Ingestibles revenues in September and sales increased 27 percent compared to September 2018. Sales of Sublinguals in September 2019 have increased 11percent compared to September 2018.
 Colorado
Sales from Colorado’s adult-use and medical dispensaries reached a combined $156.6 million this past September, an eleven percent decrease from August. The September slowdown reflects both a seasonal slowdown as well as fallout from significant declines in the vape category. Compared to September 2018, sales increased by 14 percent. Year-to-date through September, sales in the Centennial state reached an impressive $1.3 billion, a 13 percent increase from the same period in 2018.
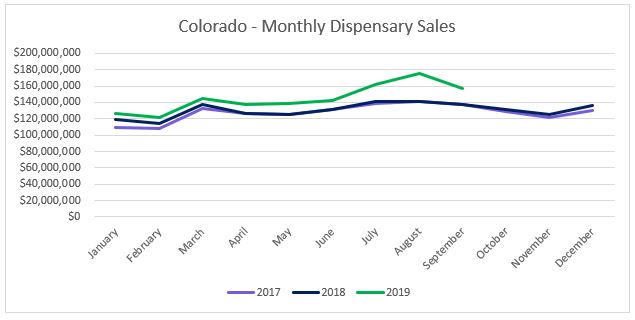
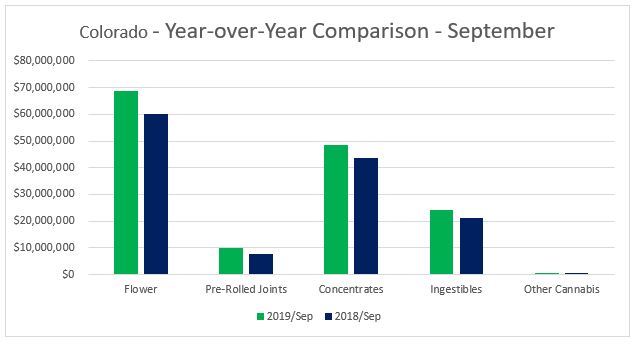
In September, Flower contributed 44 percent towards all revenues with $69 million in sales. Compared to the trailing month, the four percent decline in sales outperformed all other major categories. Year-to-date through September, sales of Flower have increased by seven percent, reaching $539.9 million. Pre-Rolled Joints sales generated $10.1 million this past September, a 33 percent increase compared to September of 2018. Year-to-date through September, sales of Pre-Rolled Joints have increased 17 percent, reaching $78.3 million.
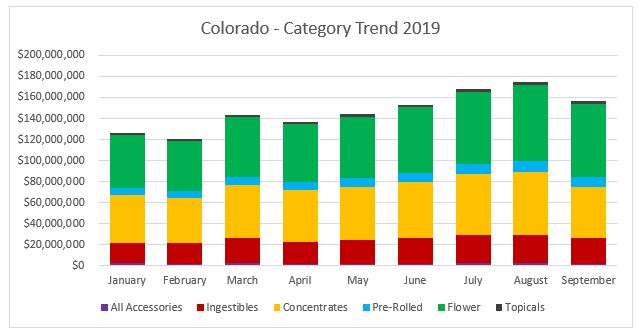
In September, sales of Concentrates contributed 31 percent towards overall revenues with $48.7 million in sales. Year-to-date through September, sales of Concentrates have grown by 21 percent. Compared to the trailing month, sales of concentrates declined 19 percent . The sharp decline was driven by a 23 percent drop in vape sales.
Ingestibles reside as the third largest product category in Colorado. In September, sales of Ingestibles were $24.2 million, a 17 percent increase compared to September 2018. The $208.5 million generated in year-to-date sales represents a 17 percent increase compared to the same time period in 2018. The Ingestibles category includes the subcategories of Edibles and Sublinguals. Year-to-date sales revenues from Edibles sales grew by 15 percent while the smaller Sublinguals segment grew by 29 percent compared to the same period in 2018.
 Nevada
Combined sales for Nevada’s medical and recreational dispensaries totaled at $56.9 million this past September, a nine percent decrease from August. Compared to September 2018, sales increased by 16 percent overall. Year-to-date through September, sales have increased 22 percent compared to the same period in 2018, reaching $516.7 million.
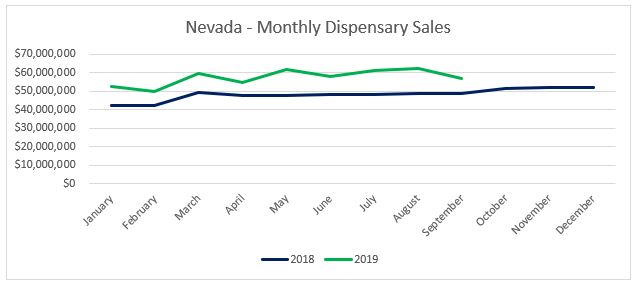
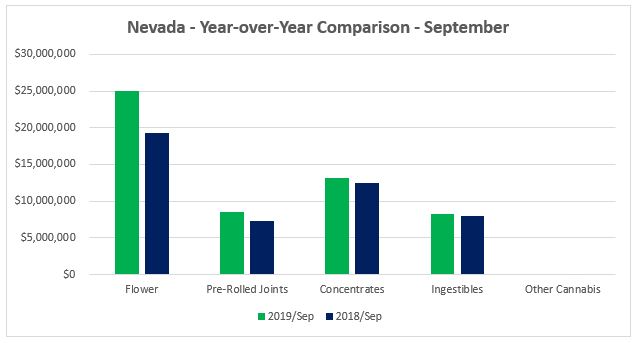
Flower sales reached $25 million in September 2019, contributing 44 percent towards overall sales revenue. The four percent decline in flower revenues compared to the trailing month was less than declines in other categories which allowed flower’s share of total sales to increase. Compared to September, sales of flower in the recent period have increased 31 percent.
The $8.6 million generated from Pre-Rolled Joints in September 2019 contributed 15 percent towards overall revenues for the month. Compared to September 2018, sales increased 16 percent. Overall, year-to-date sales in the category have increased 12 percent compared to the year prior.
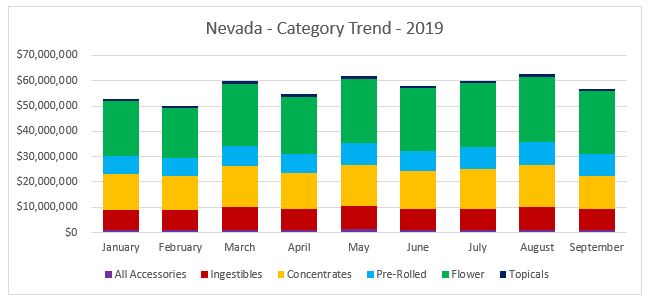
Concentrates contributed 23 percent towards total revenues in September. The $13.2 million in sales represented a four percent increase from September 2018. Through the first three quarters of 2019, Concentrates sales have increased 41 percent over the same time period in 2018 to $133.8 million. Concentrates sales are segmented into dabbable and vape products. Compared to September 2018, sales increased four percent for both sub-categories.
Sales of Ingestibles generated $8.3 million for the month of September and contributed 15 percent towards monthly revenues. Year-over-year sales in September increased three percent. Year-to-date, the $76.9 million in Ingestibles sales was 15 percent greater compared to the prior year. The Ingestibles category includes both the Edibles and Sublinguals subcategories. Edibles contributed 84 percent towards Ingestibles revenues in September, while Sublinguals contributed the remaining 16 percent. Year-to-date, sales of Edibles have increase 12 percent; Sublinguals sales have increased 36 percent over the same period.
 Maryland
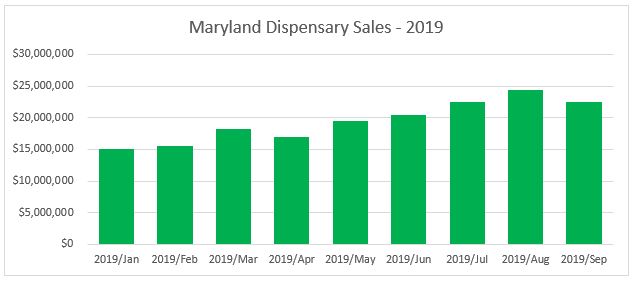
We are pleased to announce the first release of reporting on dispensary sales for the state of Maryland. Maryland is BDSA’s first expansion to an East Coast market. Reporting for Maryland begins with January 2019 and will be on a monthly release schedule along with the other states available in BDSA’s GreenEdge™ reporting platform.
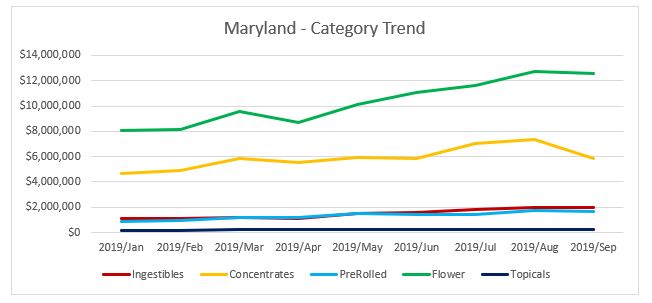
Sales for Maryland’s medical dispensaries were $22.5 million this past September, an eight percent decline from the trailing month. Year-to-date through September, sales across all product categories have reached $175.1 million. New dispensaries are opening each month and as access increases so are sales. Sales in Q3 increased 22 percent from the trailing quarter.
 In September, Flower sales reached $12.6 million, accounting for 56 percent of overall revenues for the month. The one percent decline in flower sales as compared to the trailing month outperformed all other major product categories. In Q3, flower sales generated $37 million in revenues, a 24 percent increase from the trailing quarter.
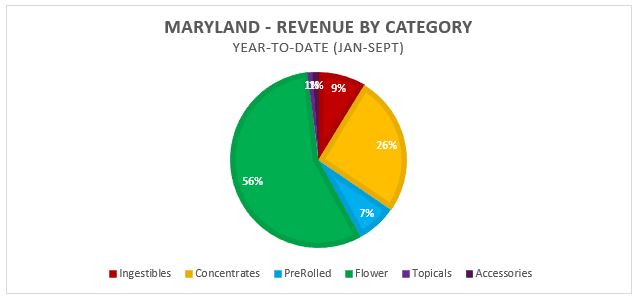 Pre-Rolled Joints remain a small category in Maryland’s medical-only market. Sales of Pre-Rolled Joints were $1.7 million in September, $4.9 million in Q3 and $12 million in year-to-date through September. Compared to the trailing month, sales in September declined five percent but remain up 19 percent over the previous quarter.
The Concentrates product category accounted for 26 percent towards overall revenues in September, a four-point decline from the year-to-date. The $5.8 million in September Concentrates sales was a 21 percent decline from the trailing month. Vape sales dropped 25 percent in September compared to August, but the category still grew 19 percent in the Q3 compared to the trailing quarter.
Sales of Ingestibles generated $1.9 million in September 2019 and contributed nearly nine percent towards total revenues for the month. Compared to August, sales in the category declined three percent. Ingestibles sales reached $5.8 million in Q3, a 37 percent jump from the trailing month, the most of any major product category.
 For readers looking for a deeper look at cannabis markets across these five states and more, including segmentation by additional product categories, brand and item detail, longer history, and segmentation by product attributes, learn how the BDS Analytics GreenEdge Platform can provide you with unlimited access to the most accurate and actionable data and analysis.