![]()
Innovative Industrial Properties Reports Fourth Quarter and Full-Year 2019 Results
Acquisitions Drive 269% Q4 Revenue, 311% Q4 Net Income and 293% Q4 AFFO Growth Year-over-Year
Fourth Quarter 2019 and Year-to-Date Highlights
Financial Results and Financing Activity
- IIP generated total revenues of approximately $17.7 million in the quarter, representing a 269% increase from the prior year’s quarter.
- IIP recorded net income available to common stockholders of approximately $9.6 million for the quarter, or $0.78 per diluted share, and adjusted funds from operations (“AFFO”) of approximately $14.3 million, or $1.18 per diluted share. AFFO and AFFO per diluted share represented increases of 293% and 211% from the prior year’s quarter, respectively.
- IIP paid a quarterly dividend of $1.00 per common share on January 15, 2020 to stockholders of record as of December 31, 2019, representing a 186% increase from the prior year’s quarter and a 28% increase from IIP’s third quarter 2019 dividend of $0.78 per common share.
- In September, IIP established an “at-the-market” equity offering program, issuing shares of common stock from September through today for net proceeds totaling approximately $184.8 million.
- Subsequent to the end of the quarter, in January, IIP completed an underwritten public offering of 3,412,969 shares of common stock, including the exercise in full of the underwriters’ option to purchase an additional 445,170 shares, resulting in gross proceeds of approximately $250.0 million.
Investment Activity
- From October 1, 2019 through today, IIP acquired 20 properties, totaling approximately 1.0 million rentable square feet (including expected rentable square feet upon completion of properties under development), located in Colorado, Florida, Illinois, Michigan, North Dakota, Ohio, Pennsylvania and Virginia, and executed five lease amendments to provide additional tenant improvements at properties located in Arizona, California, Massachusetts and Pennsylvania.
- These 20 properties and five lease amendments represented an aggregate investment by IIP of approximately $308.4 million (consisting of purchase prices and development / tenant reimbursement commitments, but excluding transaction costs).
- In these transactions, IIP established new tenant relationships with Cresco Labs Inc., GR Companies Inc. (Grassroots), Green Thumb Industries Inc. (GTI) and LivWell Holdings, Inc., while expanding existing tenant relationships with Green Leaf Medical, LLC, Green Peak Industries LLC, Maitri Genetics, LLC, PharmaCann LLC, The Pharm, LLC, Trulieve Cannabis Corp. and Vireo Health, Inc.
- From January 1, 2019 through today, IIP has grown its property portfolio from eleven properties comprising approximately 1.0 million rentable square feet in nine states, to 51 properties comprising approximately 3.2 million rentable square feet in 15 states. Also since January 1, 2019, IIP’s total investment in its property portfolio has increased by 307% from $167.4 million to $680.7 million (consisting of purchase prices and development / tenant reimbursement commitments, but excluding transaction costs and approximately $51.5 million in the aggregate, which represents funds that tenants at certain properties may not elect to have IIP disburse to them and pay IIP the corresponding base rent on).
Board of Directors
- IIP expanded its board of directors to six members, and appointed Mary Allis Curran, a former senior banking executive, as the sixth member; with Ms. Curran also appointed to serve on the board’s audit committee and nominating and corporate governance committee.
Portfolio Update and Acquisition Activity
Portfolio Update
IIP acquired the following properties and made the following additional funds available to tenants for improvements at IIP’s properties during the period from October 1, 2019 through February 26, 2020 (dollars in thousands):
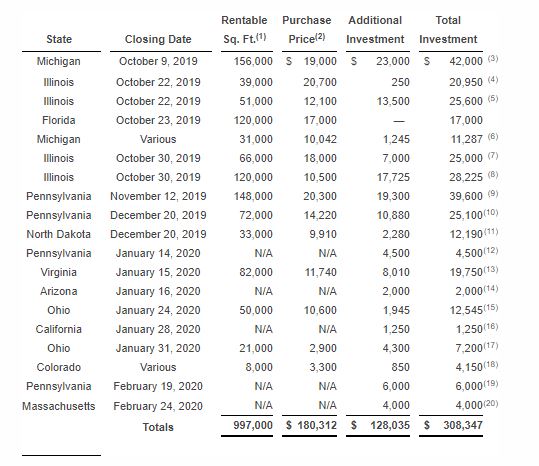
(1) Includes expected rentable square feet at completion of construction.
(2) Excludes transaction costs.
(3) The tenant is expected to complete tenant improvements at the property, for which IIP agreed to provide reimbursement of up to $23.0 million. As of February 26, 2020, IIP funded approximately $11.2 million of the reimbursement.
(4) The tenant is expected to complete tenant improvements at the property, for which IIP agreed to provide reimbursement of up to approximately $250,000. As of February 26, 2020, IIP funded approximately $244,000 of the reimbursement.
(5) The tenant is expected to complete tenant improvements at the property, for which IIP agreed to provide reimbursement of up to approximately $13.5 million. As of February 26, 2020, IIP funded approximately $9.4 million of the reimbursement.
(6) The portfolio consists of six retail properties, with one property closing on October 25, 2019, three properties closing on November 4, 2019, one property closing on November 8, 2019 and one property closing on November 25, 2019. The tenant is expected to complete tenant improvements at certain of the properties, for which IIP agreed to provide reimbursement of up to approximately $1.2 million. As of February 26, 2020, IIP had funded approximately $312,000 of the tenant improvement allowance.
(7) The tenant is expected to perform construction at the property, for which IIP agreed to provide reimbursement of up to $7.0 million. As of February 26, 2020, IIP funded approximately $2.0 million of the reimbursement.
(8) The tenant is expected to complete tenant improvements at the property, for which IIP agreed to provide reimbursement of up to approximately $17.7 million, of which $10.7 million and $7.0 million are subject to reduction at the tenant’s option before April 30, 2020 and July 30, 2020, respectively. As of February 26, 2020, IIP had funded approximately $1.9 million of the tenant improvement allowance.
(9) The tenant is expected to complete tenant improvements at the property, for which IIP agreed to provide reimbursement of up to $19.3 million. As of February 26, 2020, IIP had funded approximately $1.0 million of the tenant improvement allowance.
(10) The tenant is expected to complete tenant improvements at the property, for which IIP agreed to provide reimbursement of up to approximately $10.9 million. As of February 26, 2020, IIP had funded approximately $1.0 million of the tenant improvement allowance.
(11) The tenant is expected to complete tenant improvements at the property, for which IIP agreed to provide reimbursement of up to approximately $2.3 million. As of February 26, 2020, IIP had funded approximately $1.2 million of the tenant improvement allowance.
(12) The amount relates to a lease amendment which increased the tenant improvement allowance under a lease at one of IIP’s Pennsylvania properties by $4.5 million to a total of approximately $8.3 million. As of February 26, 2020, IIP had funded $3.4 million of the tenant improvement allowance.
(13) The tenant is expected to complete tenant improvements at the property, for which IIP agreed to provide reimbursement of up to approximately $8.0 million. As of February 26, 2020, IIP had funded approximately $2.7 million of the tenant improvement allowance.
(14) The amount relates to a lease amendment which increased the tenant improvement allowance under a lease at one of IIP’s Arizona properties by $2.0 million to a total of $5.0 million. As of February 26, 2020, IIP had funded approximately $4.5 million of the tenant improvement allowance.
(15) The tenant is expected to complete tenant improvements at the property, for which IIP agreed to provide reimbursement of up to approximately $1.9 million. As of February 26, 2020, IIP had not funded any of the tenant improvement allowance.
(16) The amount relates to a lease amendment which increased the tenant improvement allowance under a lease at one of IIP’s California properties by approximately $1.3 million. As of February 26, 2020, IIP had funded approximately $1.0 million of the tenant improvement allowance.
(17) The tenant is expected to complete tenant improvements at the property, for which IIP agreed to provide reimbursement of up to $4.3 million. As of February 26, 2020, IIP had not funded any of the tenant improvement allowance.
(18) The portfolio consists of two retail properties, with one property closing on February 19, 2020 and one property closing on February 21, 2020. The tenant is expected to complete tenant improvements at one of the properties, for which IIP agreed to provide reimbursement of up to $850,000. As of February 26, 2020, IIP had not funded any of the tenant improvement allowance.
(19) The amount relates to a lease amendment which increased the tenant improvement allowance under a lease at one of IIP’s Pennsylvania properties by $6.0 million to a total of $16.0 million, which additional allowance may be drawn by the tenant starting on March 1, 2020. As of February 26, 2020, IIP had funded $8.8 million of the tenant improvement allowance.
(20) The amount relates to a lease amendment and development agreement amendment which increased the construction funding at one of IIP’s Massachusetts properties by $4.0 million for a total of $27.5 million. IIP also canceled a remaining commitment to provide construction funding of $4.0 million for the tenant at one of IIP’s Pennsylvania properties. As of February 26, 2020, IIP had funded approximately $23.0 million of the construction funding at the Massachusetts property.
From January 1, 2019 through February 26, 2020, IIP acquired 40 properties, totaling approximately 2.2 million rentable square feet (including expected rentable square feet upon completion of properties under development), located in Arizona, California, Colorado, Florida, Illinois, Massachusetts, Michigan, Nevada, North Dakota, Ohio, Pennsylvania and Virginia, and executed ten lease amendments to provide additional tenant improvements at properties located in Arizona, California, Illinois, Massachusetts, Michigan, Minnesota and Pennsylvania.
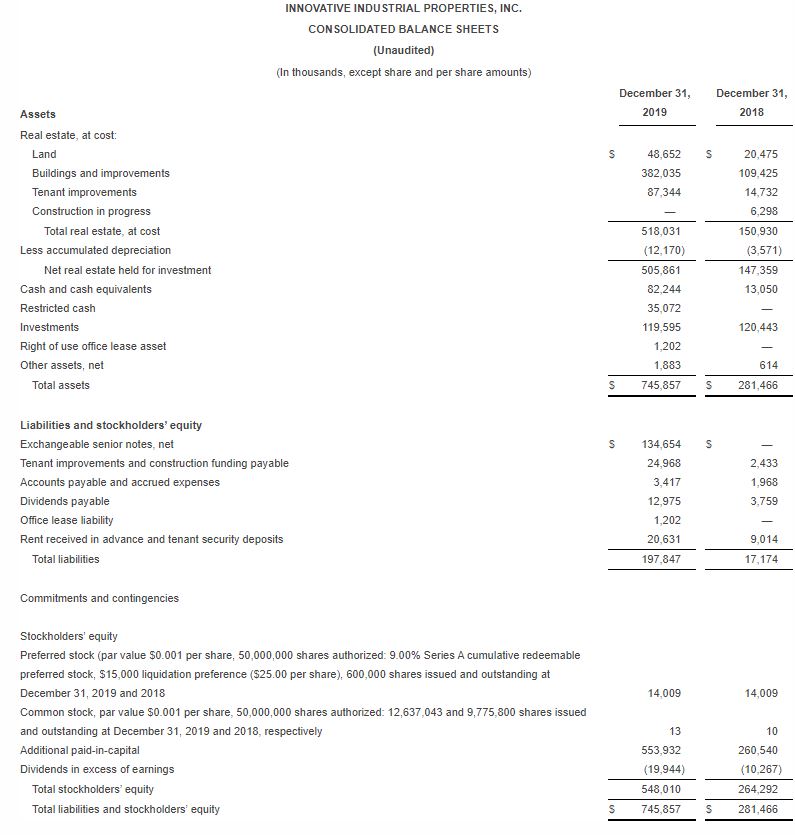
As of February 26, 2020, IIP owned 51 properties located in Arizona, California, Colorado, Florida, Illinois, Maryland, Massachusetts, Michigan, Minnesota, New York, Nevada, North Dakota, Ohio, Pennsylvania and Virginia, totaling approximately 3.2 million rentable square feet (including approximately 871,000 rentable square feet under development/redevelopment), which were 98.9% leased (based on square footage) with a weighted-average remaining lease term of approximately 15.6 years. As of February 26, 2020, IIP had invested approximately $563.2 million in the aggregate (excluding transaction costs) and had committed an additional approximately $117.5 million to reimburse certain tenants and sellers for completion of construction and tenant improvements at IIP’s properties. IIP’s average current yield on invested capital is approximately 13.3% for these 51 properties, calculated as (a) the sum of the current base rents, supplemental rent (with respect to the lease with a tenant at one of IIP’s New York properties) and property management fees (after the expiration of applicable base rent abatement or deferral periods), divided by (b) IIP’s aggregate investment in these properties (excluding transaction costs and including aggregate potential development/redevelopment funding and tenant reimbursements of approximately $117.5 million). These statistics do not include up to approximately $15.9 million that may be funded in the future pursuant to IIP’s lease with a tenant at one of IIP’s Illinois properties, or the approximately $35.7 million that may be funded in the future pursuant to IIP’s lease with a tenant at one of IIP’s Massachusetts properties, as the tenants at those properties may not elect to have IIP disburse those funds to them and pay IIP the corresponding base rent on those funds. These statistics also treat IIP’s Los Angeles, California property as not leased, due to the tenant’s default in its obligation to pay rent at that location in January and February 2020.
Financing Activity
In September 2019, IIP entered into equity distribution agreements with three sales agents, pursuant to which IIP may offer and sell from time to time through an “at-the-market” offering program up to $250 million in shares of its common stock. From September through today, IIP sold shares of its common stock for net proceeds of approximately $184.8 million under this program.
Subsequent to the end of the quarter, in January 2020, IIP completed an underwritten public offering of 3,412,969 shares of common stock, including the exercise in full of the underwriters’ option to purchase an additional 445,170 shares, resulting in gross proceeds of approximately $250.0 million.
IIP expects to use the net proceeds from these offerings to invest in specialized industrial real estate assets that support the regulated medical-use cannabis cultivation and processing industry and for general corporate purposes.
Financial Results
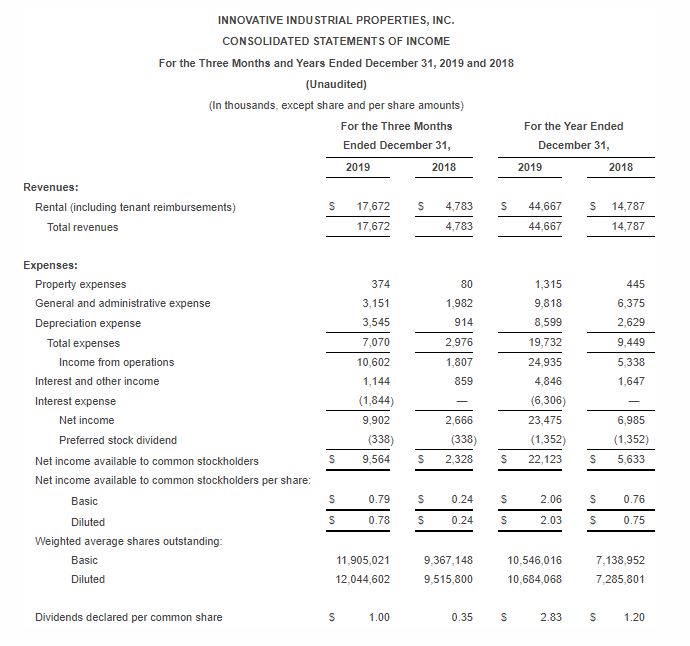
IIP generated total revenues of approximately $17.7 million for the three months ended December 31, 2019, compared to approximately $4.8 million for the same period in 2018, an increase of 269%. IIP generated total revenues of approximately $44.7 million for the year ended December 31, 2019, compared to approximately $14.8 million for 2018, an increase of 202%. The increase in both periods was driven primarily by the acquisition and leasing of new properties, in addition to contractual rental escalations at certain properties.
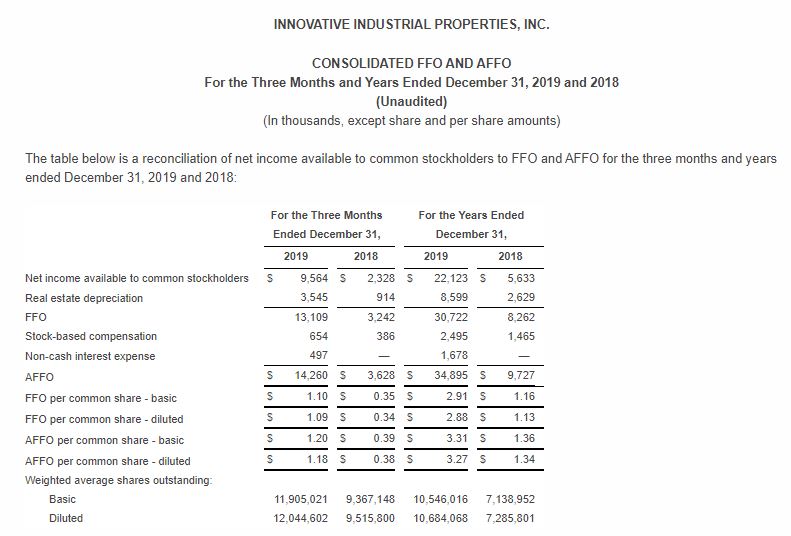
For the three months ended December 31, 2019, IIP recorded net income available to common stockholders and net income available to common stockholders per diluted share of approximately $9.6 million and $0.78, respectively; funds from operations (“FFO”) and FFO per diluted share of approximately $13.1 million and $1.09, respectively; and AFFO and AFFO per diluted share of approximately $14.3 million and $1.18, respectively. Fourth quarter 2019 AFFO and AFFO per diluted share for the quarter increased by 293% and 211% from the prior year period, respectively.
For the year ended December 31, 2019, IIP recorded net income available to common stockholders and net income available to common stockholders per diluted share of $22.1 million and $2.03, respectively; FFO and FFO per diluted share of $30.7 million and $2.88, respectively; and AFFO and AFFO per diluted share of approximately $34.9 million and $3.27, respectively. 2019 AFFO and AFFO per diluted share increased by 259% and 144% from the prior year, respectively.
FFO and AFFO are supplemental non-GAAP financial measures used in the real estate industry to measure and compare the operating performance of real estate companies. A complete reconciliation containing adjustments from GAAP net income available to common stockholders to FFO and AFFO and definitions of terms are included at the end of this release.
Teleconference and Webcast
Innovative Industrial Properties, Inc. will conduct a conference call and webcast at 10:00 a.m. Pacific Time (1:00 p.m. Eastern Time) on Thursday, February 27, 2020 to discuss IIP’s financial results and operations for the fourth quarter and year ended December 31, 2019. The call will be open to all interested investors through a live audio webcast at the Investor Relations section of IIP’s website at www.innovativeindustrialproperties.com, or live by calling 1-877-328-5514 (domestic) or 1-412-902-6764 (international) and asking to be joined to the Innovative Industrial Properties, Inc. conference call. The complete webcast will be archived for 90 days on IIP’s website. A telephone playback of the conference call will also be available from 12:00 p.m. Pacific Time on Thursday, February 27, 2020 until 12:00 p.m. Pacific Time on Thursday, March 5, 2020, by calling 1-877-344-7529 (domestic), 855-669-9658 (Canada) or 1-412-317-0088 (international) and using access code 10139231.
About Innovative Industrial Properties
Innovative Industrial Properties, Inc. is a self-advised Maryland corporation focused on the acquisition, ownership and management of specialized industrial properties leased to experienced, state-licensed operators for their regulated medical-use cannabis facilities. Innovative Industrial Properties, Inc. has elected to be taxed as a real estate investment trust, commencing with the year ended December 31, 2017. Additional information is available at www.innovativeindustrialproperties.com.
 FFO and FFO per share are operating performance measures adopted by the National Association of Real Estate Investment Trusts, Inc. (NAREIT). NAREIT defines FFO as the most commonly accepted and reported measure of a REIT’s operating performance equal to “net income, computed in accordance with accounting principles generally accepted in the United States (GAAP), excluding gains (or losses) from sales of property, plus depreciation, amortization and impairment related to real estate properties, and after adjustments for unconsolidated partnerships and joint ventures.”
Management believes that net income, as defined by GAAP, is the most appropriate earnings measurement. However, management believes FFO and FFO per share to be supplemental measures of a REIT’s performance because they provide an understanding of the operating performance of IIP’s properties without giving effect to certain significant non-cash items, primarily depreciation expense. Historical cost accounting for real estate assets in accordance with GAAP assumes that the value of real estate assets diminishes predictably over time. However, real estate values instead have historically risen or fallen with market conditions. IIP believes that by excluding the effect of depreciation, FFO and FFO per share can facilitate comparisons of operating performance between periods. IIP reports FFO and FFO per share because these measures are observed by management to also be the predominant measures used by the REIT industry and by industry analysts to evaluate REITs and because FFO per share is consistently reported, discussed, and compared by research analysts in their notes and publications about REITs. For these reasons, management has deemed it appropriate to disclose and discuss FFO and FFO per share.
Management believes that AFFO and AFFO per share are also appropriate supplemental measures of a REIT’s operating performance. IIP calculates AFFO by adding to FFO certain non-cash and infrequent or unpredictable expenses which may impact comparability, consisting of non-cash stock-based compensation expense and non-cash interest expense.
IIP’s computation of FFO and AFFO may differ from the methodology for calculating FFO and AFFO utilized by other equity REITs and, accordingly, may not be comparable to such REITs. Further, FFO and AFFO do not represent cash flow available for management’s discretionary use. FFO and AFFO should not be considered as an alternative to net income (computed in accordance with GAAP) as an indicator of IIP’s financial performance or to cash flow from operating activities (computed in accordance with GAAP) as an indicator of IIP’s liquidity, nor is it indicative of funds available to fund IIP’s cash needs, including IIP’s ability to pay dividends or make distributions. FFO and AFFO should be considered only as supplements to net income computed in accordance with GAAP as measures of IIP’s operations.