A Detailed Look at Cannabis Sales in California, Oregon, Arizona, Colorado and Nevada
We are pleased to share with our readers overviews of five important Western cannabis markets compiled by BDS Analytics for the month of February. BDS Analytics offers a full understanding of the evolving cannabis market though several offerings, including its GreenEdge Retail Sales Tracking, Consumer Insights, Industry Intelligence and CBD Market Monitor divisions. For those not familiar with the Colorado-based company, which was founded in 2015 and is run by co-founders CEO Roy Bingham and President Liz Stahura, we have been covering their progress since almost day 1.
During February, the sixth month after the onset of the vaping crisis, sales across the five markets totaled $579.9 million, down 0.8% from January’s $584.5 million due to two fewer days in the month. Overall sales growth from a year ago among the five Western markets ranged from 11% in California to as high as 37% in Arizona. Concentrates, which represented 22.5-35.1% of sales by market, have improved from recent months but remain below the 26-38% in August before the vaping crisis hit. Growth in concentrates from a month ago ranged from -11% in Nevada to +2% in Arizona and Oregon, while flower sales ranged from -5% in Arizona and Nevada to +3% in California. After declining sharply in January from February, pre-rolls normalized, with February growth rates ranging from -4% in Nevada to 12% in Arizona.
Here is a closer look at each market, as detailed by BDS Analytics:
Arizona
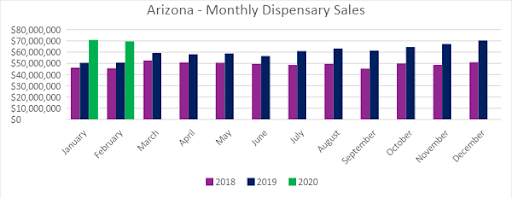
In February 2020, cannabis sales in Arizona’s medical dispensaries were $69.5 million, a two percent decline from January. Compared to the previous February, sales in Arizona grew by over 37 percent. Year-to-date through February, sales have reached $140.3 million, a $39.2 million increase from the same period last year, representing 39 percent growth.
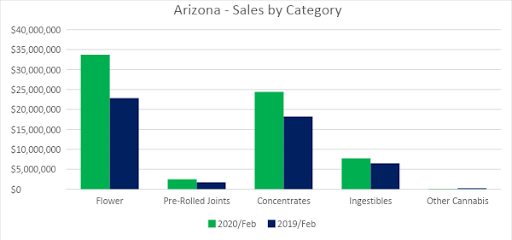
Flower sales accounted for nearly 49 percent of overall revenue for the month with $33.8 million in sales. Pre-rolled Joints, which are tracked as a separate category, accounted for nearly four percent of revenue with $2.5 million in sales. Compared to the previous February, sales of both Flower and Pre-rolled Joints increased by 47 percent.
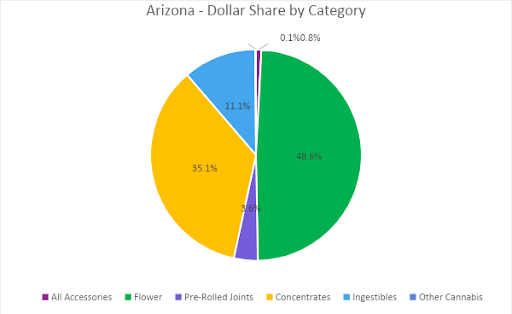
Concentrate sales accounted for more than 35 percent of overall revenues with sales totaling $24.4 million in February. Vape products, the largest segment of the Concentrates category, generated $16 million in sales, accounting for 66 percent of the Arizona Concentrates market and 23 percent of sales across all categories. Compared to February 2019, sales of Dabbable Concentrates grew by 36 percent, while Vape sales grew by 33 percent.
The Ingestibles category accounted for 11 percent of sales in February with $7.7 million in revenue. In February, the $7 million in sales from Edibles (a sub-category within Ingestibles) generated nearly 91 percent of Ingestibles sales overall, while Sublinguals made up the remaining nine percent. Compared to the previous February, Edibles sales increased by 27 percent and Sublingual sales decreased 27 percent.
California
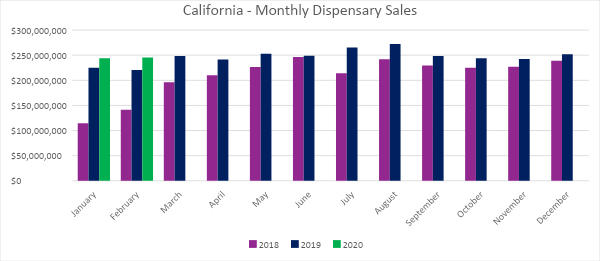
In February 2020, cannabis sales for state licensed retailers and delivery services reached $245.6 million, growing by one percent from the trailing month. Compared to February 2019, sales increased by 11 percent. Year to date, sales in California have reached $489.3 million, a 10 percent increase compared to the same period in 2019.
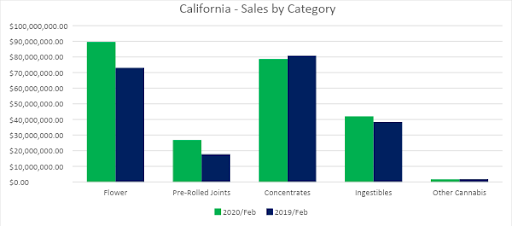
 Sales from Flower generated $89.6 million in February 2020, accounting for nearly 36 percent of overall revenues. Compared to the trailing month and February 2019, Flower sales increased by three percent and 23 percent, respectively. Pre-rolled Joints, which are tracked as a separate category, accounted for almost 11 percent of overall February revenues with $26.9 million in sales.
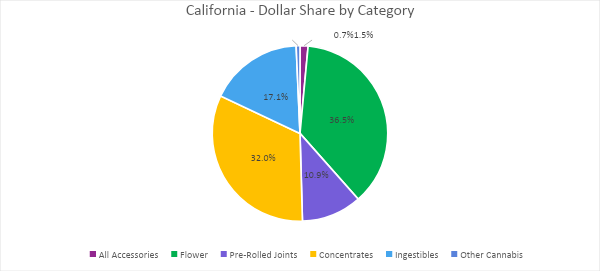
Concentrates were the second-largest category for revenue in February 2020, reaching $78.6 million in sales and accounting for 32 percent of total revenue. Compared to the trailing month and February 2019, sales decreased by one percent and three percent, respectively. The $62.4 million in Vape sales accounted for 79 percent of the Concentrates category and 25 percent of the month’s overall sales revenue.
In February 2020, Ingestibles generated $41.9 million in sales, a one percent decline from the trailing month. Compared to February 2019, sales of Ingestibles grew by more than nine percent. Edibles contributed 82 percent of Ingestibles revenue, while Sublinguals made up the remaining 17 percent. Compared to February 2019, the Edibles and Sublinguals categories grew by 17 percent and declined by 16 percent, respectively.
Colorado
February 2020 sales in Colorado’s adult-use and medical dispensaries reached a combined $137.1 million, a three percent decline from January. Compared to the previous February, sales increased more than 13 percent. Adult-use retailers experienced a 15 percent sales increase from February 2019 while medical sales increased by seven percent. Year-to-date through February, combined channel sales have reached $278.1 million, increasing 12 percent from the previous year.

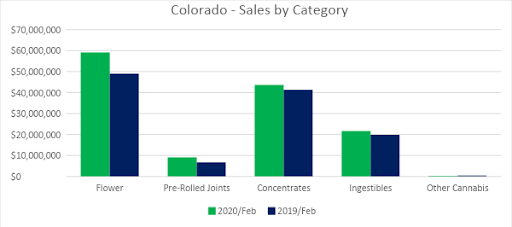
In February, Flower sales accounted for more than 43 percent of total monthly revenues, totaling at $59.1 million. Flower sales decreased nearly three percent from the trailing month but increased by 21 percent from the previous February. Year-to-date, sales have increased by 19 percent in the category over the same period last year. Pre-rolled Joints, which are tracked separately from Flower, generated $9.1 million in sales for February 2020, a 36 percent increase from February 2019 and two percent decline from the trailing month.
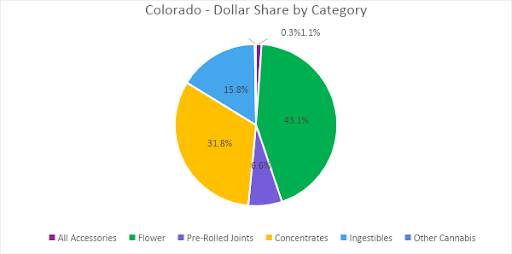
The $43.6 million in Concentrate sales during February 2020 represented six percent growth from the previous year, but a two percent decline from the trailing month. The category accounted for 32 percent of revenue for the month. Vape products, the largest segment within the Concentrates category, reached $21.2 million in February sales, growing by five percent from February 2019. The Vape category accounted for 49 percent of Concentrates’ revenue and 15 percent of overall sales for the month.
In February 2020, sales from Ingestibles generated $21.6 million, a nine percent increase from February 2019. Compared to the trailing month, however, sales in the category decreased by nearly four percent. Edibles generated $20.1 million in monthly sales revenue, contributing 93 percent to the Ingestibles category. Sublinguals made up the remaining seven percent, totaling at $1.5 million for the month.
Nevada
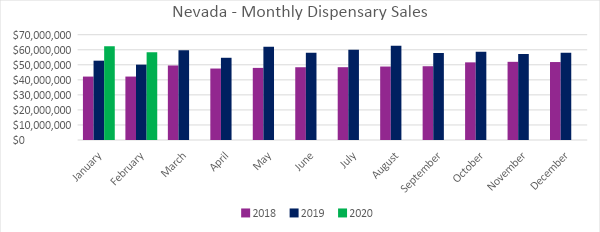
In February, Nevada dispensaries generated $58.4 million in sales. Compared to February of 2019, sales grew by 16 percent. Compared to the trailing month, however, sales declined by six percent.
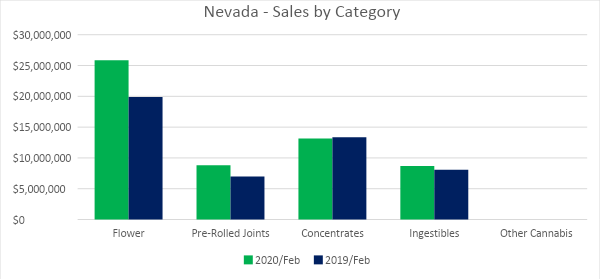
Flower sales accounted for 44 percent of overall February sales. Sales in the category reached $25.9 million for the month, a five percent decline from January. Pre-rolled Joints, tracked separately from Flower, accounted for more than 15 percent of February sales with nearly $8.8 million in revenue.
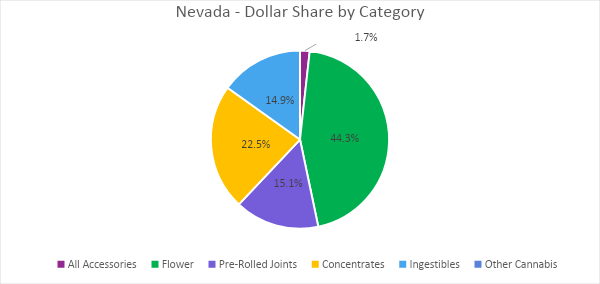
Concentrate sales for the month of February reached $13.1 million, accounting for more than 23 percent of overall revenue for the month. Compared to the previous February, concentrate sales declined by two percent and declined 11 percent from January 2020.
Sales in the Ingestibles category accounted for 15 percent of all revenues, totaling $8.7 million in sales for the month of February, growing eight percent from the previous year. Compared to January, category sales decreased by five percent.
Oregon
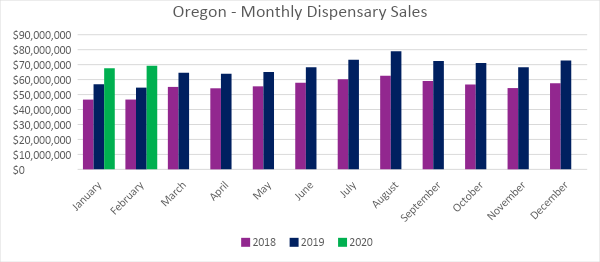
In February 2020, Cannabis sales to adult-use customers and medical patients in Oregon dispensaries reached $69.3 million. Compared to the trailing month, sales in the Oregon market grew by nearly three percent. Compared to February 2019, sales grew by 27 percent overall. Year-to-date sales in Oregon have reached $138.9 million, a 23 percent increase compared to the same period in 2019.
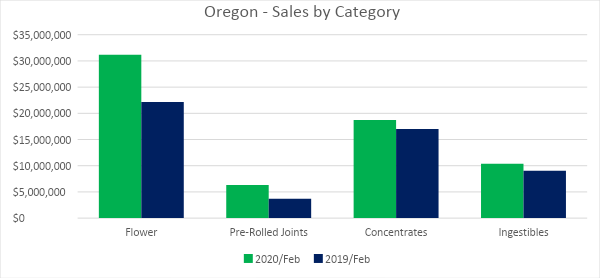
Sales of Flower generated $31.2 million in February 2020, accounting for 45 percent of overall revenues. Compared to the trailing month, Flower sales increased by one percent; compared to February 2019, sales increased by 41 percent. Pre-rolled Joints, which are tracked as a separate category, accounted for nine percent of overall revenues with $6.3 million in sales.
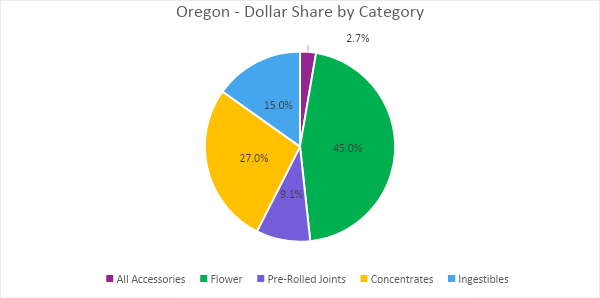
Concentrates generated $18.7 million in sales this past February. Compared to the trailing month, sales in the category increased by about two percent. Compared to February 2019, however, sales in the category grew more than 10 percent.
In February 2020, Ingestibles generated $10.4 million in sales, a three percent increase from the previous month. Compared to February 2019, sales of Ingestibles grew by 15 percent. Edibles, which made up 81 percent of the Ingestibles category and 12 percent of overall monthly sales, generated $8.4 million dollars in February 2020.
For readers looking for a deeper look at cannabis markets across these five states and more, including segmentation by additional product categories, brand and item detail, longer history, and segmentation by product attributes, learn how the BDS Analytics GreenEdge Platform can provide you with unlimited access to the most accurate and actionable data and analysis.