A Detailed Look at Cannabis Sales in California, Oregon, Arizona, Colorado and Nevada
We are pleased to share with our readers overviews on five important Western cannabis markets compiled by BDS Analytics for the month of July. BDS Analytics offers a full understanding of the evolving cannabis market though several offerings, including its GreenEdge Retail Sales Tracking, Consumer Insights, Industry Intelligence and CBD Market Monitor divisions. For those not familiar with the Colorado-based company, which was founded in 2015 and is run by co-founders CEO Roy Bingham and President Liz Stahura, we have been covering their progress since almost day 1.
During July, sales increased in excess of 22% compared to July 2018 in all markets except Colorado, which posted 15% growth. While flower sales increased in all markets, growth is being driven by extracts and ingestibles, with the exception of Nevada, where flower sales were quite robust. Pre-rolls have been a very strong sub-sector, but July saw strong growth only in California (+66%). While Colorado’s pre-roll sales matched the overall growth of its market, the growth in sales of pre-rolls in Oregon, Arizona and Nevada trailed market growth.
Here is a more detailed look at each market, as detailed by BDS Analytics:
California
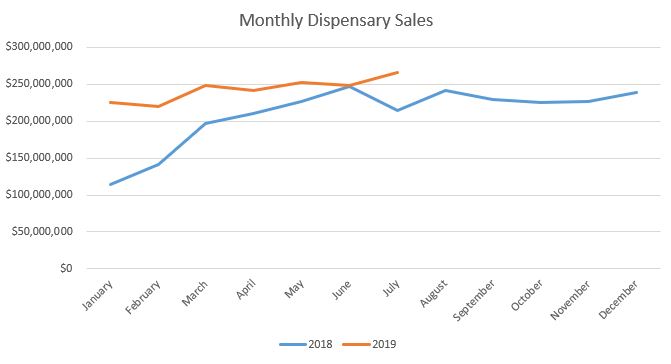
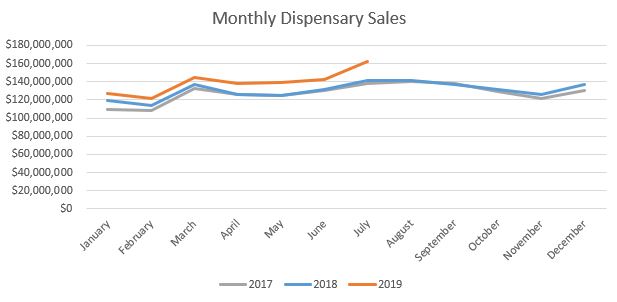
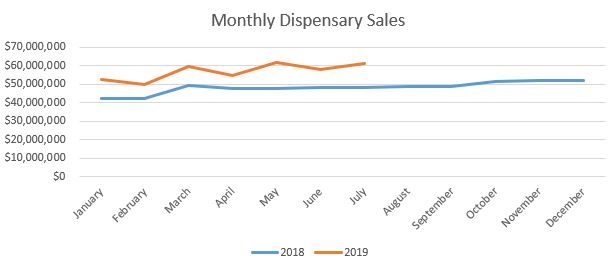
This past July, sales for California’s licensed dispensaries and delivery services reached a combined $265.5 million, increasing seven percent from June. Year-over-year sales for the month of July show an increase of 24 percent and the combined year-to-date sales of $1.7 billion indicate 26 percent growth compared to July 2018.
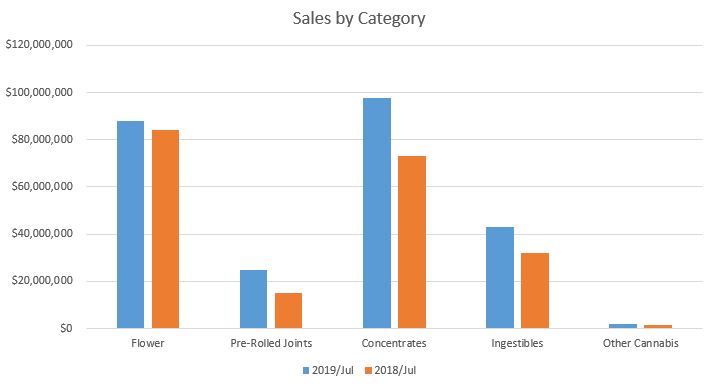
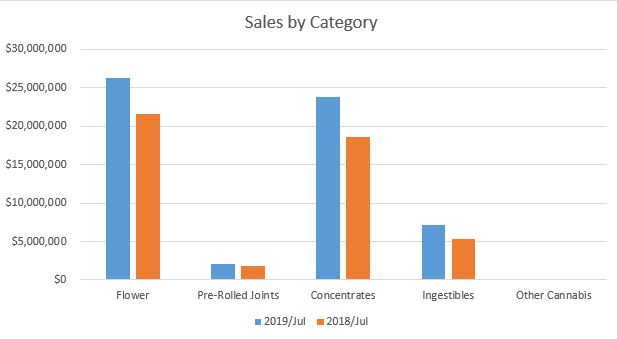
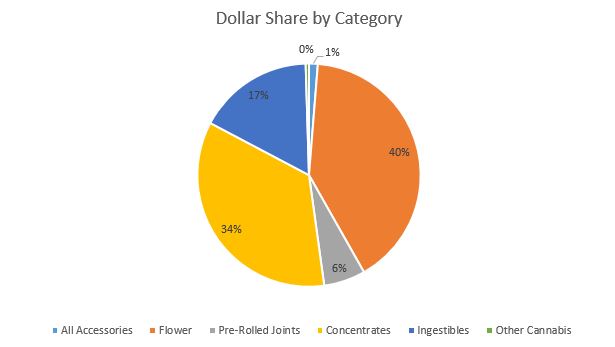
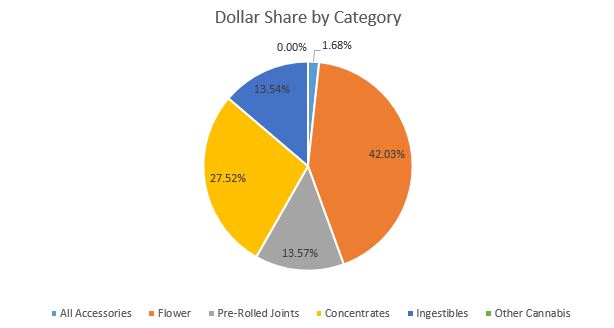
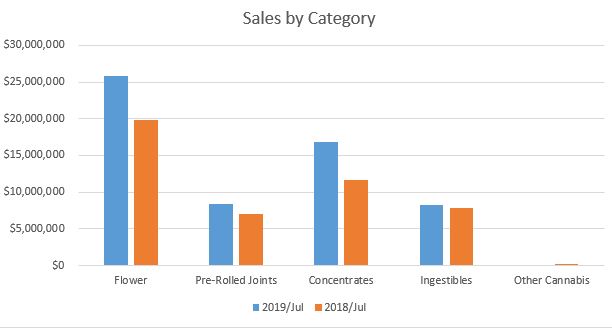
 In July, Flower contributed 33 percent towards overall revenues with $87.6 million in sales. Compared to June, sales in the category increased eight percent; and, compared to July 2018, sales increased four percent. Year-to-date through July, sales of Flower reached $557.5 million, a seven percent increase compared to the same time period in 2018. This increase in revenue can be attributed to a 15 percent sales volume increase as a result of a six percent decline in the average retail price of Flower.
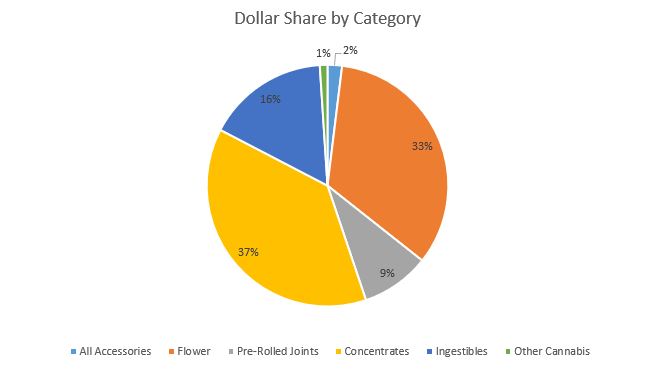 This past July, consumers in California spent $25 million on Pre-Rolled Joints, a 66 percent increase compared to July 2018. While sales of Flower have ceded share to other categories, Pre-Rolled Joints are another matter. This past July, revenues from Pre-rolled Joints contributed nine percent towards overall revenue in California.
Concentrates, a classification that includes extracts, solventless concentrates and vape products remained the largest category by sales revenue accounting for 37 percent share of overall revenue for the month. The $97.5 million in Concentrates sales represented nearly eight percent growth from the trailing month and 33 percent growth compared to July 2018. In the first seven months of 2019, Concentrates dollar sales increased by 43 percent and total units sold increased by 41 percent compared to the same time period in 2018.
Vape sales dominate the Concentrates category every month, July of 2019 was no exception. Vape products made up 81 percent of the total units sold and 84 percent of dollar sales within the Concentrates category.
Sales of Ingestibles reached $43.1 million this past July and contributed 16 percent towards overall revenues. Compared to July 2018, sales in the category increased by 35 percent. Year-to-date through July, unit sales volume increased 28 percent and average retail prices have decreased six percent. Total revenues indicate an overall growth of 35 percent compared to the same time period in 2018. The Ingestibles category includes both Edibles and Sublingual products. Compared to July of 2018, revenues from Edibles increased by 41 percent while Sublinguals increased by 17 percent.
 Oregon
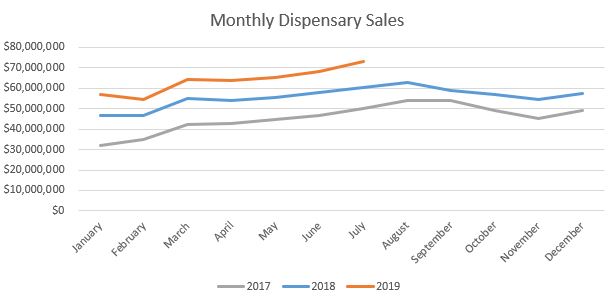
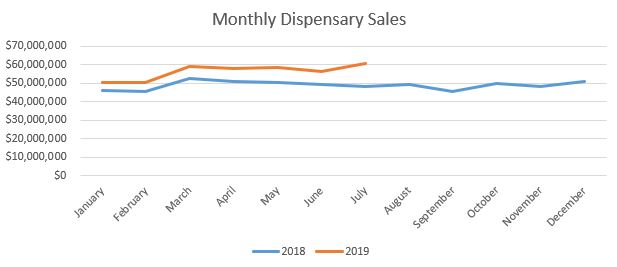
Oregon dispensary sales reached $73.3 million this past July, a seven percent increase from June. Compared to July 2018, sales increased by 22 percent overall. Year-to-date through July, sales have increased by 19 percent compared to the same period in 2018, reaching $446.6 million.
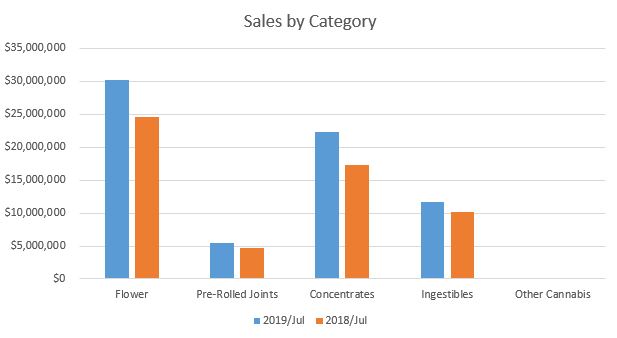
Flower sales reached $30.1 million in July 2019, contributing 41 percent towards overall sales revenue. Flower sales increased by seven percent from the trailing month and increased by 22 percent compared to July 2018. Year-to-date through July, Flower sales have increased 13 percent compared to 2018, reaching $181.5 million. Growth in the Flower category was driven by significant increases in sales volume, triggered by reduced prices. The average retail price for a gram of Flower in July 2019 was 15 percent lower than in July 2018.
The $5.5 million generated from Pre-Rolled Joints in July 2019 contributed seven percent towards overall revenues for the month. Compared to July 2018, sales increased 18 percent. Year-to-date through July, sales in the category grew 12 percent compared to the year prior.
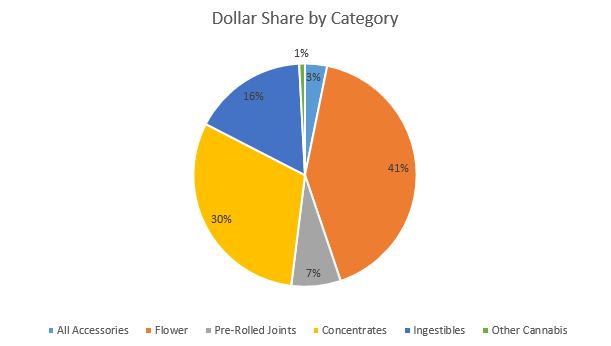 Sales within the Concentrates category contributed 30 percent towards revenues in July. The $22.3 million in Concentrate sales represented 29 percent growth from July 2018. In the first seven months of 2019, Concentrate sales have increased 31 percent over the same period in 2018 reaching $137.3 million. Concentrate sales are segmented into dabbable and vape products. Compared to July 2018, sales increased 33 and 28 percent for the two subcategories, respectively.
Sales of Ingestibles generated $11.7 million in July and contributed 16 percent towards revenues for the month. Year-over-year sales in July increased by 15 percent. Year-to-date, the $72 million in Ingestibles sales represented 21 percent growth compared to the same period in 2018. The Ingestibles category includes both the Edible and Sublingual subcategories. Edibles contributed 76 percent towards Ingestibles revenues for the month of July. Year-to-date, sales of Edibles have increased 18 percent and sales of Sublinguals have increased 38 percent over the prior year.
 Arizona
Sales for Arizona’s medical dispensaries were $61 million this past July, an eight percent increase from June 2019. Compared to July 2018, sales increased by 26 percent. Year-to-date sales increased by 15 percent compared the same period in 2018, reaching $394.6 million.
 In July, the $26.4 million in sales from Flower contributed 43 percent towards overall revenues for the month. Flower sales increased by 11 percent from the trailing month and 22 percent from the year prior. Year-to-date, Flower sales have increased six percent, reaching $165.6 million.
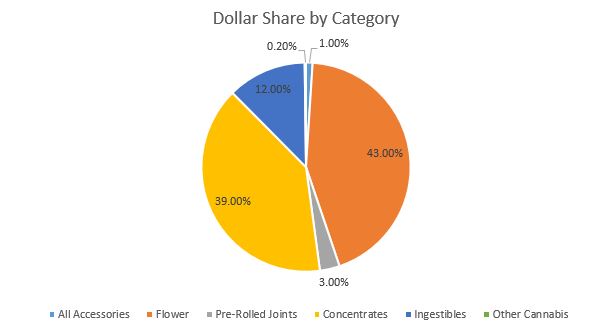 Pre-Rolled Joints remain a small category in Arizona’s medical-only market. Sales of Pre-Rolled Joints were $2.1 million in July and $14.2 million in the first seven months of 2019. Compared to 2018, sales for the month increased 18 percent and year-to-date sales increased nine percent. In the most recent reporting period, the category contributed three percent towards overall revenues.
The Concentrates product category contributed 39 percent towards overall revenues in July. The $23.9 million in Concentrates sales represented 28 percent growth compared to July 2018. In the first seven months of 2019, Concentrates sales increased 21 percent compared to the same period last year, reaching $154.8 million. Concentrates sales are segmented into Dabbable and Vape products. Compared to July 2018, sales increased 19 and 33 percent for the two categories, respectively.
Sales of Ingestibles generated $7.1 million in sales in July 2019 and contributed 12 percent towards total revenues for the month. Compared to July 2018, sales increased over 34 percent. Year-to-date, the $49.7 million sold in Ingestibles was 31 percent greater compared to the same period in 2018. The Ingestibles category includes both the Edible and Sublingual subcategories. Edibles sales contributed 85 percent towards Ingestibles revenues in July and sales increased 31 percent compared to July 2018. Sales of Sublinguals in July 2019 have increased 57 percent compared to July 2018.
 Colorado
Sales from Colorado’s adult-use and medical dispensaries reached a combined $162.6 million this past July, a six percent increase from June. Compared to July 2018, sales increased by 15 percent. Year-to-date through July, sales in the Centennial state reached $991 million, an 11 percent increase from the same period in 2018.
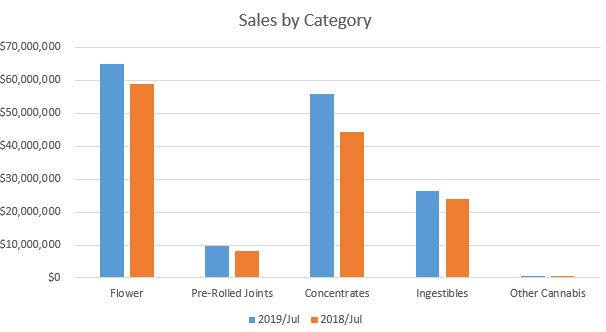
 In July, Flower contributed 40 percent towards all revenues with $65 million in sales. Compared to July 2018, the category experienced a nine percent increase in sales, and a five percent increase compared to the trailing month. Year-to-date through July, sales of Flower have increased by one percent, reaching $399 million. Pre-Rolled Joint sales generated $9.9 million this past July, a 25 percent increase compared to July of 2018. Year-to-date through July, sales of Pre-Rolled Joints have increased 10 percent, reaching $56.4 million.
Concentrates are the second largest category by revenue. In July, sales of Concentrates contributed 34 percent towards overall revenues with $55.8 million in sales. Year-to-date through July, sales of Concentrates have grown by 22 percent. While Concentrates sales in other state markets are dominated by the Vape segment, Colorado Vape sales make up only 56 percent of revenues in the broader Concentrates category. Year-to-date, Vape sales grew 49 percent compared to the same period in 2018. Dabbable Concentrates, which comprise the other 44 percent of Concentrates sales, only grew three percent within the same period.
Ingestibles remain the third largest product category. In July, sales of Ingestibles were $26.5 million, a 14 percent increase compared to July 2018. The $159.7 million generated in year-to-date sales represents a 17 percent increase compared to the same time period in 2018. The Ingestibles category includes the subcategories of Edibles and Sublinguals. Year-to-date sales revenues from Edibles sales grew by 15 percent while the smaller Sublinguals segment grew by 38 percent compared to the same period in 2018.
 Nevada
Combined sales for Nevada’s medical and recreational dispensaries totaled at $61.3 million this past July, a six percent increase from June. Compared to July 2018, sales increased by 27 percent overall. Year-to-date through July, sales have increased 22 percent compared to the same period in 2018, reaching $398.6 million.
 Flower sales reached $25.8 million in July 2019, contributing 42 percent towards overall sales revenue. Flower sales increased by three percent from the trailing month and increased by 30 percent compared to July 2018. Year-to-date through July, Flower sales have increased 12 percent compared to 2018, reaching $162.8 million.
The $8.3 million generated from Pre-Rolled Joints in July 2019 contributed almost 14 percent towards overall revenues for the month. Compared to July 2018, sales increased 18 percent. Overall, year-to-date sales in the category have increased 18 percent compared to the year prior
 Concentrates contributed 28 percent towards total revenues in July. The $16.9 million in sales represented a 45 percent increase from July 2018. In the first seven months of 2019, Concentrates sales have increased 60 percent over the same time period in 2018 to $108.4 million. Concentrates sales are segmented into dabbable and vape products. Compared to 2018, sales increased 33 and 48 percent for the two subcategories, respectively.
Sales of Ingestibles generated $8.3 million in sales for the month of July and contributed 14 percent towards monthly revenues. Year-over-year sales in July increased seven percent. Year-to-date, the $59.3 million in Ingestibles sales was 18 percent greater compared to the prior year. The Ingestibles category includes both the Edible and Sublingual subcategories. Edibles contributed 80 percent towards Ingestibles revenues in July, while Sublinguals contributed the remaining 20 percent. Year-to-date, sales of Edibles have increase 12 percent; Sublinguals sales have increased 59 percent over the same period.
 For readers looking for a deeper look at cannabis markets across these five states and more, including segmentation by additional product categories, brand and item detail, longer history, and segmentation by product attributes, learn how the BDS Analytics GreenEdge Platform can provide you with unlimited access to the most accurate and actionable data and analysis.
Note: A previous version of this article had several errors that have been corrected subsequently