A Detailed Look at Cannabis Sales in California, Oregon, Arizona, Colorado, Nevada and Maryland
We are pleased to share with our readers overviews on five important Western cannabis markets as well as Maryland compiled by BDS Analytics for the month of November. BDS Analytics offers a full understanding of the evolving cannabis market though several offerings, including its GreenEdge Retail Sales Tracking, Consumer Insights, Industry Intelligence and CBD Market Monitor divisions. For those not familiar with the Colorado-based company, which was founded in 2015 and is run by co-founders CEO Roy Bingham and President Liz Stahura, we have been covering their progress since almost day 1.
During November, the third month after the onset of the vaping crisis, sales across the six markets totaled $607.6 million, down 1.8% from October due to seasonal patterns primarily. Sales growth from a year ago among the five Western markets ranged from 7% in California to as high as 39% in Arizona. Concentrates, which represented 23-32% of sales by market (compared to 22-32% in October, 23-33% in September and 26-38% in August), grew more slowly within each market than overall sales grew due to reduced sales of vape pens, which ranged from -17% in Oregon to +24% in Arizona. Compared to October, vape pens experienced negative growth ranging in Colorado and Oregon and positive growth in the other four markets, including California (+2%). It is clear that consumers have shifted from vape pens to flower and pre-rolls as well as ingestibles.
Here is a closer look at each market, as detailed by BDS Analytics:
Arizona
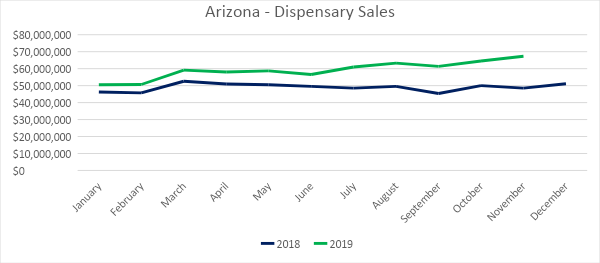
Sales for Arizona’s medical dispensaries were $67.3 million this past November, a four percent increase from October. Compared to November 2018, sales increased nearly 39 percent. Year-to-date through November, sales have reached $651.1 million, a 21 percent increase from the same period last year.
In November, sales of flower reached $34.9 million, accounting for nearly 52 percent of overall revenues for the month. Flower sales increased by three percent from the trailing month and 55 percent from the year prior. Year-to-date, Flower sales have increased 25 percent, reaching $313.6 million.

Pre-Rolled Joints remain a small category in Arizona’s medical-only market. The $2.3 million in revenue from the sale of pre-rolled joints in November represented just three percent of revenues for the month. Compared to 2018, sales for the month increased 30 percent and year-to-date sales increased 12 percent.
The Concentrates product category accounted for 32 percent towards overall revenues in November. The $21.5 million in Concentrates sales represented 24 percent growth compared to November 2018Year-to-date through November, Concentrates sales increased 17 percent compared to the same period last year, reaching $225.8 million. Concentrates sales are segmented into Dabbable and Vape products. Compared to November 2018, sales within both sub-categories increased 24 percent.
Sales of Ingestibles generated $7.6 million in sales in November 2019 and contributed 11 percent towards total revenues for the month. Compared to November 2018, sales increased 31 percent. Year-to-date, the $76 million sold in Ingestibles was 24 percent greater compared to the same period in 2018. The Ingestibles category includes both Edibles and Sublinguals. Edibles sales contributed 89 percent towards Ingestibles revenues in November and sales increased 34 percent compared to November 2018. Sales of Sublinguals in November 2019 have increased 13 percent compared to November 2018.

California
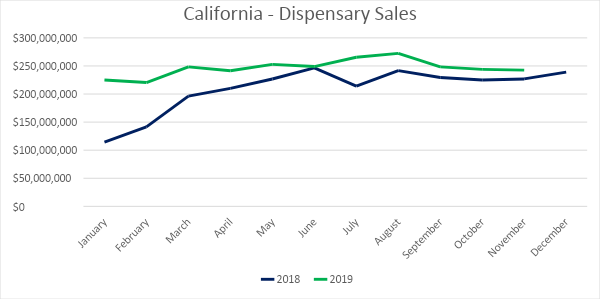
This past November, sales for California’s licensed dispensaries and delivery services reached a combined $242.7 million, decreasing half of one percent from October. Year-over-year sales for the month of November show an increase of seven percent, and the combined year-to-date sales of more than $2.7 billion indicate 19 percent growth compared to November 2018.
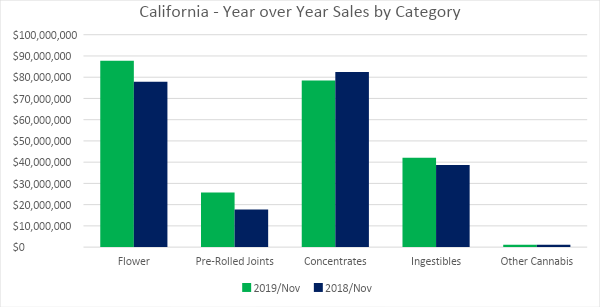
In November, Flower contributed over 36 percent towards overall revenues with $87.7 million in sales. Compared to October, sales in the category decreased two percent; compared to November 2018, sales increased 13 percent. Year-to-date through November, sales of Flower have reached $921.1 million, a seven percent increase compared to the same time period in 2018. Contributing almost 11 percent towards overall revenue in California, Pre-Rolled Joints sales generated $25.8 million this past November, a 45 percent increase compared to November of 2018. Year-to-date through November, sales of Pre-Rolled Joints have increased 44 percent, reaching $253.2 million.
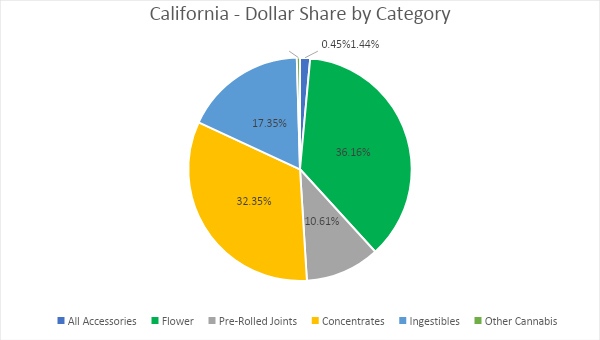 This past November, the $78.5 million in Concentrates sales represented an increase of one percent from the trailing month and a five percent decrease compared to November 2018. Year-to-date through November, Concentrates dollar sales increased by nearly 26 percent compared to the same time period in 2018, reaching $952.9 million.
Sales of Ingestibles reached $42.1 million this past November, contributing 17 percent towards overall revenues. Compared to November 2018, sales in the category increased by nine percent. Year-to-date revenues indicate an overall growth of 26 percent compared to the same time period in 2018, reaching $462.2 million in year-to-date sales. The Ingestibles category includes both Edibles and Sublinguals, while also distinguishing the two subcategories. Compared to November of 2018, revenues from Edibles increased by 15 percent while Sublinguals decreased by 13 percent.
 Colorado
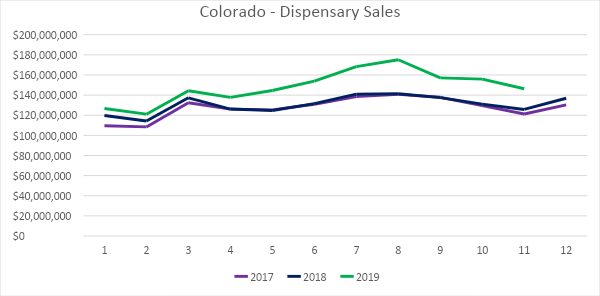
Sales from Colorado’s adult-use and medical dispensaries reached a combined $146.3 million this past November, a five percent decrease from October. The month-to-month decline was indicative of a seasonal slowdown. Compared to November 2018, sales increased by 16 percent. Year-to-date through November, sales in the Centennial state have reached an impressive $1.6 billion, a 14 percent increase from the same period in 2018.
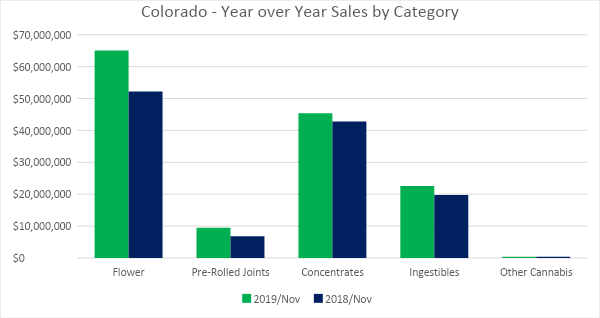
In November, Flower contributed 44 percent towards all revenues with $65.1 million in sales. The category experienced a 25 percent increase in sales compared to November 2018, and a six percent decrease compared to the trailing month. Year-to-date through November, sales of Flower have increased by more than 10 percent, reaching $685.1 million. Pre-Rolled Joints sales generated $9.5 million this past November, a 40 percent increase compared to November of 2018. Year-to-date through November, sales of Pre-Rolled Joints have increased 22 percent, reaching $97.6 million.
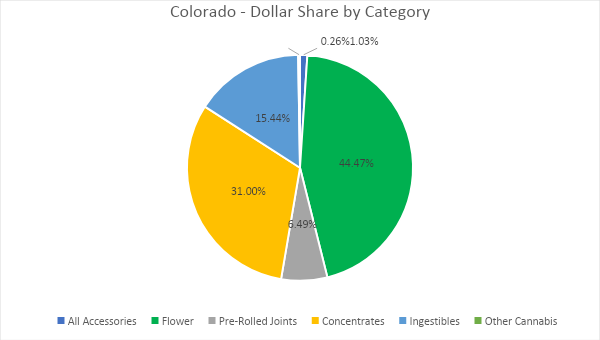
Concentrates remain the second largest category by revenue. In November, sales of Concentrates contributed 31 percent towards overall revenues with $45.4 million in sales. Year-to-date through November, sales of Concentrates have grown by more than 18 percent. While Concentrates sales in other state markets are often dominated by the Vape segment, Colorado Vape sales continue to make up only 48 percent of revenues in the broader Concentrates category. Year-to-date, Vape sales grew 38 percent compared to the same period in 2018. Dabbable Concentrates, which comprise the other 52 percent of Concentrates sales, only grew four percent within the same period.
Ingestibles reside as the third largest product category. In November, sales of Ingestibles were $22.6 million, a 14 percent increase compared to November 2018. The $257.7 million generated in year-to-date sales represents a 16 percent increase compared to the same time period in 2018. The Ingestibles category includes the subcategories of Edibles and Sublinguals. Year-to-date sales revenues from Edibles sales grew by 15 percent while the smaller Sublinguals segment grew by 24 percent compared to the same period in 2018.
Maryland
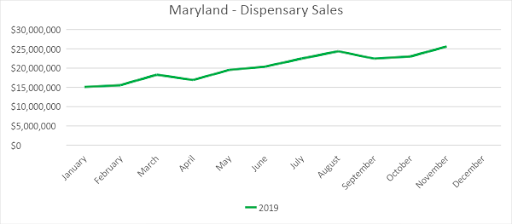
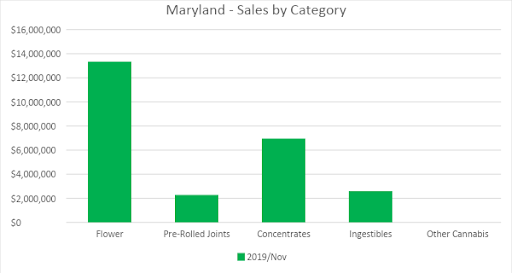
Sales for Maryland’s medical dispensaries were $25.6 million this past November, an 11 percent increase from October. Year-to-date through November, sales have reached $224.4 million.
In November, Flower sales reached $13.3 million, accounting for more than 52 percent of overall revenues for the month. Compared to the trailing month, sales for the category increased 10 percent by revenue and 13 percent by volume.
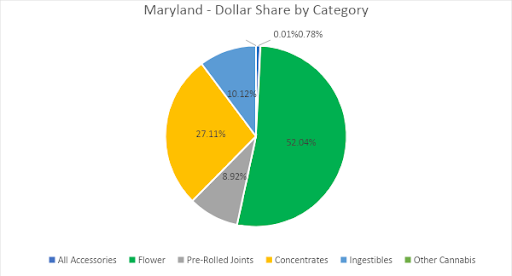
Pre-Rolled Joints remain a small category in Maryland’s medical-only market. Sales of Pre-Rolled Joints were $2.3 million in November and $16.5 million year-to-date through November. Sales for the category increased nine percent in November from the trailing month.
The Concentrates product category accounted for 27 percent towards overall revenues in November. Concentrate sales increased 11 percent from the trailing month. Sales of vapes which account for 67 percent of concentrate sales increased 12 percent from October. Year-to-date through November, concentrate sales in Maryland reached $66.5 million.
Sales of Ingestibles generated $2.6 million in sales in November 2019 and contributed 10 percent towards total revenues for the month. Compared to the trailing month, sales of ingestibles increased 19 percent. The category is segmented into edibles and sublinguals, compared to the trailing month of edibles increased 22 percent while sublingual sales declined over two percent.
Nevada
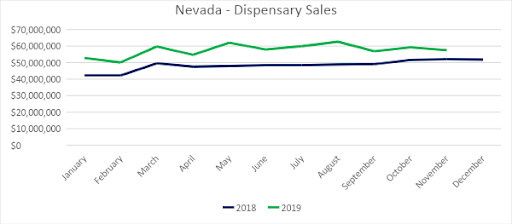
Combined sales for Nevada’s medical and recreational dispensaries totaled at $57.5 million this past November, a less than one percent decrease from October. Compared to November 2018, sales increased by 11 percent overall. Year-to-date through November, sales have increased 20 percent compared to the same period in 2018, reaching $633 million.
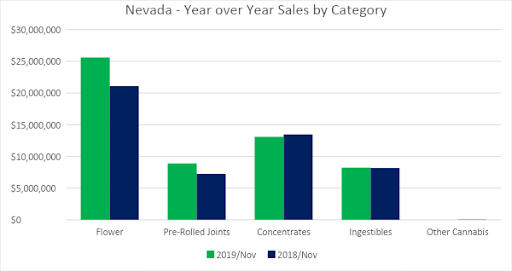
Flower sales reached $25.6 million in November 2019, contributing 44 percent towards overall sales revenue. Flower sales decreased less than one percent from the trailing month and have increased by 21 percent compared to November 2018. Year-to-date through November, Flower sales have increased 20 percent compared to 2018, reaching $266.7 million.
The $8.9 million generated from Pre-Rolled Joints in November 2019 contributed 15 percent towards overall revenues for the month. Compared to November 2018, sales increased 22 percent. Overall, year-to-date sales in the category have increased 13 percent compared to the year prior.
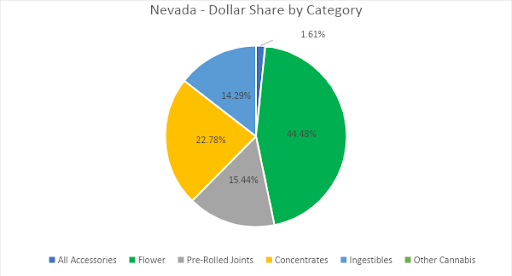
Concentrates contributed 23 percent towards total revenues in November. The $13.1 million in sales represented a three percent decrease from November 2018. Year-to-date through November, Concentrates sales have increased 31 percent over the same time period in 2018 to $160.1 million. Concentrates sales are segmented into dabbable and vape products. Compared to November 2018, sales decreased six percent and decreased two percent in the two subcategories, respectively.
Sales of Ingestibles generated $8.2 million in sales for the month of November and contributed 14 percent towards monthly revenues. Year-over-year sales in November increased one percent. Year-to-date, the $93.7 million in Ingestibles sales was 12 percent greater compared to the prior year. The Ingestibles category includes both the Edibles and Sublinguals subcategories. Edibles contributed 86 percent towards Ingestibles revenues in November, while Sublinguals contributed the remaining 14 percent. Year-to-date, sales of Edibles have increase 10 percent; Sublinguals sales have increased 25 percent over the same period.
Oregon
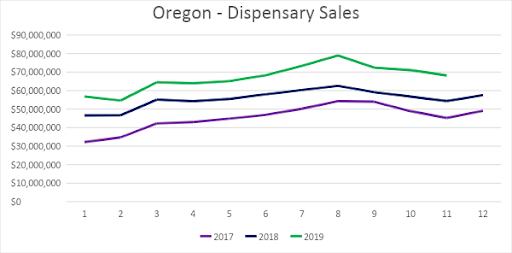
Oregon dispensary sales reached $68.2 million this past November, a four percent decrease from October. Compared to November 2018, sales increased by 26 percent overall. Year-to-date through November, sales have increased by 21 percent compared to the same period in 2018, reaching more than $737.2 million.
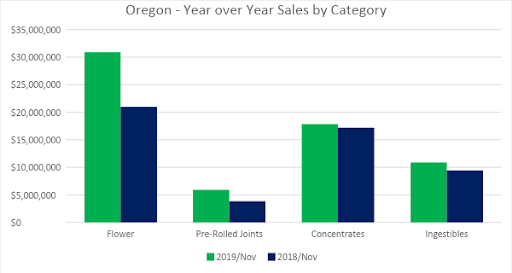
Flower sales reached $30.9 million in November 2019, accounting for 45 percent of overall revenues. Flower sales decreased four percent compared to from the trailing month; but increased by 47 percent compared to November 2018. Year-to-date through November, Flower sales have increased 22 percent compared to 2018, reaching $309.9 million. The $5.9 million generated from Pre-Rolled Joints in November 2019 contributed nine percent towards overall revenues for the month. Compared to November 2018, sales increased 51 percent. Year-to-date through November, sales in the category grew 22 percent compared to the year prior.
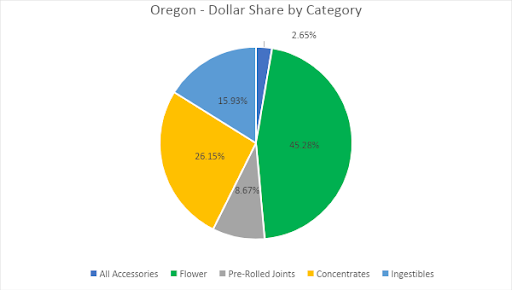
Sales within the Concentrates category contributed over 26 percent towards revenues in November. The $17.8 million in Concentrates sales represented four percent growth from November 2018. Year-to-date through November, Concentrates sales have increased 23 percent over the same period in 2018, reaching $216.7 million. Concentrates sales are segmented into dabbable and vape products. Compared to November 2018, sales of dabbable concentrates have increased 53 percent while sales of vape products have declined 17 percent as a result of the health scare.
Sales of Ingestibles generated $10.9 million in November and contributed 16 percent towards revenues for the month. Year-over-year sales in November increased by 15 percent. Year-to-date, the $117.8 million in Ingestibles sales represented 19 percent growth compared to the same period in 2018. The Ingestibles category includes both the Edibles and Sublinguals subcategories. Edibles sales contributed 79 percent towards Ingestibles revenues for the month of November. Year-to-date, sales of Edibles have increased 17 percent and sales of Sublinguals have increased 31 percent over the prior year.
For readers looking for a deeper look at cannabis markets across these five states and more, including segmentation by additional product categories, brand and item detail, longer history, and segmentation by product attributes, learn how the BDS Analytics GreenEdge Platform can provide you with unlimited access to the most accurate and actionable data and analysis.