![]()
Innovative Industrial Properties Reports First Quarter 2023 Results
Q1 2023 Net Income and AFFO Per Diluted Share Increased 8% and 10% Year-Over-Year, Respectively
SAN DIEGO, May 08, 2023–(BUSINESS WIRE)–Innovative Industrial Properties, Inc. (IIP), the first and only real estate company on the New York Stock Exchange (NYSE: IIPR) focused on the regulated U.S. cannabis industry, announced today results for the first quarter ended March 31, 2023.
First Quarter 2023
Financial Results
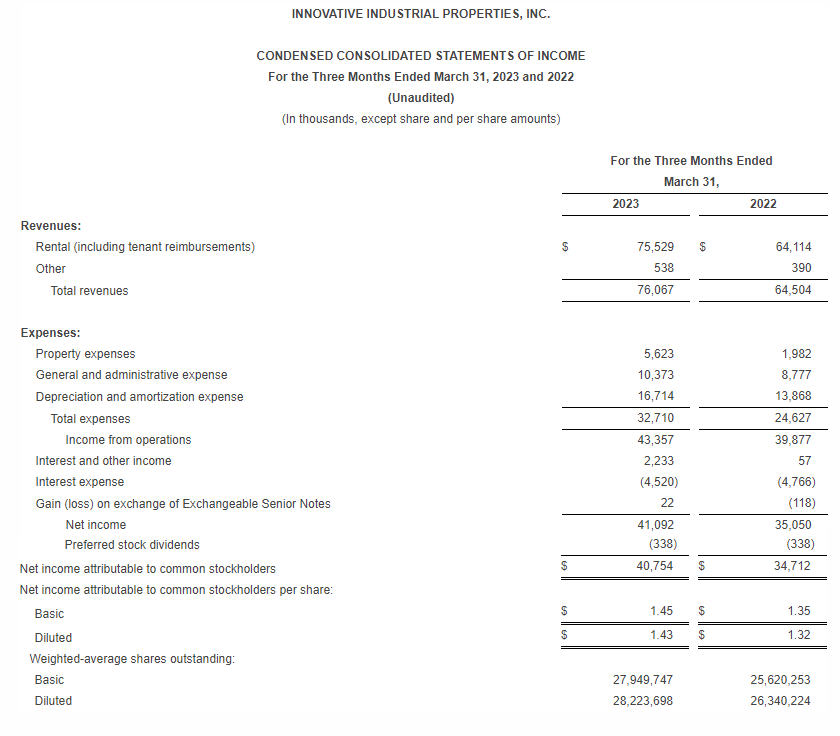
- Generated total revenues of approximately $76.1 million in the quarter, representing an 18% increase from the prior year’s quarter.
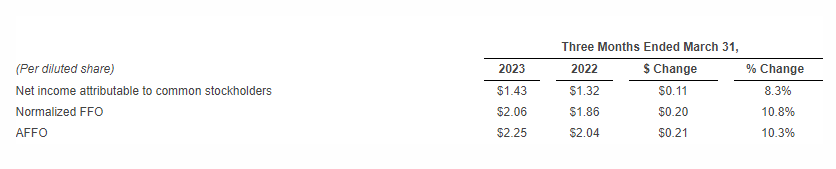
- Recorded net income attributable to common stockholders of approximately $40.8 million for the quarter, or $1.43 per diluted share.
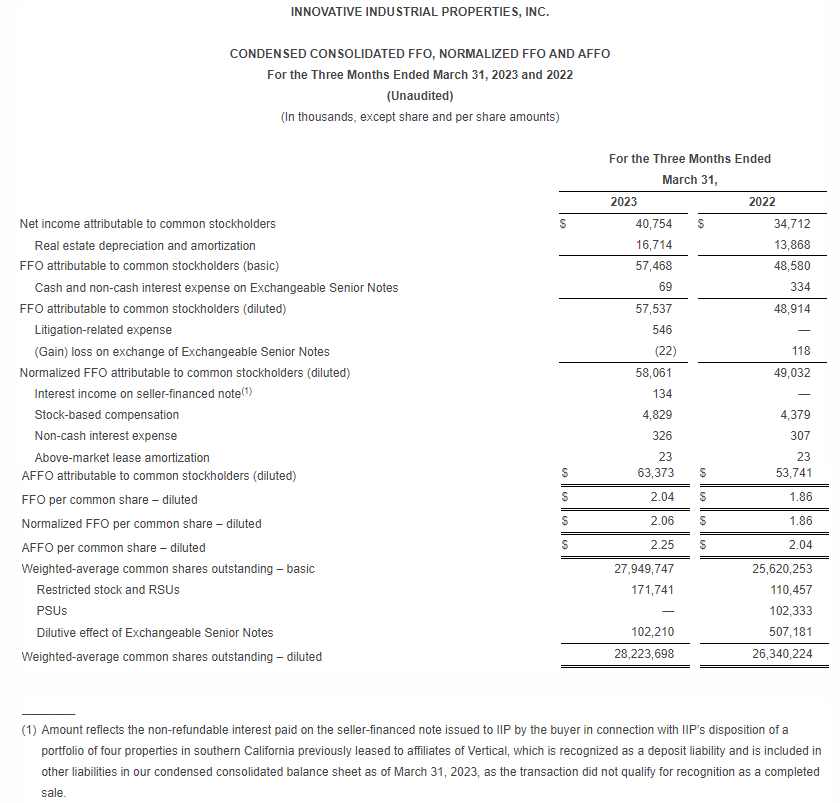
- Recorded adjusted funds from operations (AFFO) of approximately $63.4 million, or $2.25 per diluted share, increases of 18% and 10% from the prior year’s quarter, respectively.
- Paid a quarterly dividend of $1.80 per common share on April 14, 2023 to stockholders of record as of March 31, 2023 (an AFFO payout ratio of 80%), equal to an annualized dividend of $7.20 per share. The common stock dividends declared for the twelve months ended March 31, 2023 of $7.15 per common share represent an increase of $1.00, or 16%, over dividends declared for the twelve months ended March 31, 2022.
Investments / Dispositions / Leasing
- Acquired an industrial property in Ohio for $20.1 million that is expected to comprise 157,000 square feet upon completion of development and executed a long-term lease with Battle Green Holdings, LLC (Battle Green), pursuant to which IIP agreed to provide reimbursement of up to $21.9 million for completion of the development, with IIP’s total investment in the property expected to be $42.0 million. At the time of closing, the majority of the exterior buildout was completed, including roof, framing and exterior walls, and work on mechanical, electrical and plumbing systems was progressing. Battle Green is expected to complete construction of the two-story industrial facility, consisting of completion of the building shell and interior buildout of cultivation and production rooms, as well as mechanical, fertigation, electrical and plumbing systems.
- Acquired a 58,000 square foot operational cannabis cultivation facility in Pennsylvania in a long-term sale-leaseback transaction with a subsidiary of TILT Holdings Inc. for a purchase price of $15.0 million (excluding transaction costs).
- Amended IIP’s leases with Ascend Wellness Holdings Inc. in New Jersey, PharmaCann Inc. in New York and Goodness Growth Holdings Inc. in New York to provide an additional $15.0 million, $15.0 million and $4.0 million for funding of qualifying real estate infrastructure improvements at those properties, respectively, representing an aggregate of $34.0 million, with corresponding adjustments to base rent at each property. In addition, IIP added cross-default provisions to all leases with each tenant.
- Sold a portfolio of four properties in California previously leased to affiliates of Medical Investor Holdings, LLC (Vertical) for $16.2 million (excluding transaction costs), which includes a five-year secured seller financing with the buyer of the property for $16.1 million that is interest only and payable monthly.
Rent Collection
- Rent collection for IIP’s operating portfolio (calculated as base rent and property management fees collected as a percentage of contractually due base rent and property management fees) was 98% for the three months ended March 31, 2023.
- Rent collection percentage for the quarter includes approximately $1.1 million of security deposits applied in connection with previously disclosed amendments with Holistic Industries Inc. at a California property and a Michigan property, pursuant to which 100% of base rent at the two properties will be paid through application of security deposits until September 30, 2023, with pro rata payback of those security deposits over twelve months starting in January 2024.
- Rent collection percentage for the quarter also includes approximately $3.1 million of security deposits applied in connection with non-payment of rent by certain tenants, as previously disclosed (two affiliates of SH Parent, Inc. (Parallel) for a Texas property and a Pennsylvania property, and Green Peak Industries, Inc. for one property in Michigan). As of March 31, 2023, all security deposits for these properties were fully applied.
- Contractual rent not collected totaled approximately $1.6 million (approximately $1.1 million relating to defaulted tenants Parallel and Green Peak for rent in excess of IIP’s security deposits and approximately $470,000 for rent prior to the sale of the Vertical portfolio).
Balance Sheet Statistics (as of March 31, 2023)
- 12% debt to total gross assets, with approximately $2.6 billion in total gross assets.
- Total quarterly fixed cash interest obligation of approximately $4.2 million.
- No secured debt.
- No debt maturities until May 2026, other than $4.4 million principal amount of 3.75% Exchangeable Senior Notes in 2024.
- Debt service coverage ratio of 16.2x (calculated in accordance with the Company’s 5.50% Unsecured Senior Notes due 2026).
Property Portfolio Statistics (as of March 31, 2023)
- Total property portfolio comprises 108 properties across 19 states, with approximately 8.9 million rentable square feet (including approximately 1.6 million rentable square feet under development / redevelopment), consisting of:
- Operating portfolio: 103 properties, representing approximately 8.1 million rentable square feet.
- Under development / redevelopment (five properties expected to comprise 715,000 rentable square feet at completion):
- Inland Center Drive in San Bernardino, California
- Perez Road in Cathedral City, California
- 63795 19th Avenue in Palm Springs, California
- Leah Avenue in San Marcos, Texas
- Davis Highway in Windsor, Michigan
- Operating portfolio:
- 100% leased (triple-net).
- Weighted-average remaining lease term: 15.1 years.
- Total invested / committed capital per square foot: $275.
- By invested / committed capital:
- No tenant represents more than 14% of the total portfolio.
- No state represents more than 17% of the total portfolio.
- Multi-state operators (MSOs) represent 89% of the operating portfolio.
- Public company operators represent 58% of the operating portfolio.
- Industrial (cultivation and/or processing), retail (dispensing) and combined industrial/retail represents 91%, 3% and 6% of operating portfolio, respectively.
Leadership Update
In March, IIP announced that Catherine Hastings was promoted to a newly created role of Chief Operating Officer and Ben Regin was promoted to a newly created role of Chief Investment Officer. In addition, IIP announced the hiring of David Smith as Chief Financial Officer.
Financial Results
For the three months ended March 31, 2023, IIP generated total revenues of approximately $76.1 million, compared to approximately $64.5 million for the same period in 2022, an increase of 18%. The increase was driven primarily by the acquisition and leasing of new properties, additional building infrastructure allowances provided to tenants at certain properties that resulted in increases to base rent, tenant reimbursements and contractual rental escalations at certain properties. As described above, rental revenues for the three months ended March 31, 2023 also included approximately $4.2 million of security deposits applied for payment of rent for IIP’s leases with Green Peak, Parallel and Holistic. Total revenues for the three months ended March 31, 2023 and 2022 included approximately $5.2 million and $1.9 million, respectively, of tenant reimbursements for property insurance premiums and property taxes.
For the three months ended March 31, 2023, IIP recorded net income attributable to common stockholders of approximately $40.8 million, or $1.43 per diluted share; funds from operations (FFO) (diluted) of approximately $57.5 million, or $2.04 per diluted share; normalized FFO (Normalized FFO) of approximately $58.1 million, or $2.06 per diluted share; and AFFO of approximately $63.4 million, or $2.25 per diluted share.
IIP paid a quarterly dividend of $1.80 per common share on April 14, 2023 to stockholders of record as of March 31, 2023, equal to an annualized dividend of $7.20 per share. IIP’s AFFO payout ratio was 80% (calculated by dividing the common stock dividend declared per share by IIP’s AFFO per common share – diluted for the quarter). The common stock dividends declared for the twelve months ended March 31, 2023, of $7.15 per common share represent an increase of $1.00, or 16%, over dividends declared for the twelve months ended March 31, 2022.
FFO, Normalized FFO and AFFO are supplemental non-GAAP financial measures used in the real estate industry to measure and compare the operating performance of real estate companies. A complete reconciliation containing adjustments from GAAP net income attributable to common stockholders to FFO, Normalized FFO and AFFO and definitions of terms are included at the end of this release.
Supplemental Information
Supplemental financial information is available in the Investor Relations section of the IIP’s website at www.innovativeindustrialproperties.com.
Teleconference and Webcast
IIP will conduct a conference call and webcast at 10:00 a.m. Pacific Time (1:00 p.m. Eastern Time) on Tuesday, May 9, 2023 to discuss IIP’s financial results and operations for the first quarter ended March 31, 2023. The call will be open to all interested investors through a live audio webcast at the Investor Relations section of IIP’s website at www.innovativeindustrialproperties.com, or live by calling 1-877-328-5514 (domestic) or 1-412-902-6764 (international) and asking to be joined to the Innovative Industrial Properties, Inc. conference call. The complete webcast will be archived for 90 days on IIP’s website. A telephone playback of the conference call will also be available from 12:00 p.m. Pacific Time on Tuesday, May 9, 2023 until 12:00 p.m. Pacific Time on Tuesday, May 16, 2023, by calling 1-877-344-7529 (domestic), 855-669-9658 (Canada) or 1-412-317-0088 (international) and using access code 6731756.
About Innovative Industrial Properties
Innovative Industrial Properties, Inc. is a self-advised Maryland corporation focused on the acquisition, ownership and management of specialized properties leased to experienced, state-licensed operators for their regulated cannabis facilities. Innovative Industrial Properties, Inc. has elected to be taxed as a real estate investment trust, commencing with the year ended December 31, 2017. Additional information is available at www.innovativeindustrialproperties.com.
FFO and FFO per share are operating performance measures adopted by the National Association of Real Estate Investment Trusts, Inc. (NAREIT). NAREIT defines FFO as the most commonly accepted and reported measure of a REIT’s operating performance equal to net income, computed in accordance with accounting principles generally accepted in the United States (GAAP), excluding gains (or losses) from sales of property, depreciation, amortization and impairment related to real estate properties, and after adjustments for unconsolidated partnerships and joint ventures.
Management believes that net income, as defined by GAAP, is the most appropriate earnings measurement. However, management believes FFO and FFO per share to be supplemental measures of a REIT’s performance because they provide an understanding of the operating performance of IIP’s properties without giving effect to certain significant non-cash items, primarily depreciation expense. Historical cost accounting for real estate assets in accordance with GAAP assumes that the value of real estate assets diminishes predictably over time. However, real estate values instead have historically risen or fallen with market conditions. IIP believes that by excluding the effect of depreciation, FFO and FFO per share can facilitate comparisons of operating performance between periods. IIP reports FFO and FFO per share because these measures are observed by management to also be the predominant measures used by the REIT industry and industry analysts to evaluate REITs and because FFO per share is consistently reported, discussed, and compared by research analysts in their notes and publications about REITs. For these reasons, management has deemed it appropriate to disclose and discuss FFO and FFO per share.
IIP computes Normalized FFO by adjusting FFO, as defined by NAREIT, to exclude certain GAAP income and expense amounts that management believes are infrequent and unusual in nature and/or not related to IIP’s core real estate operations. Exclusion of these items from similar FFO-type metrics is common within the equity REIT industry, and management believes that presentation of Normalized FFO and Normalized FFO per share provides investors with a metric to assist in their evaluation of IIP’s operating performance across multiple periods and in comparison to the operating performance of other companies, because it removes the effect of unusual items that are not expected to impact IIP’s operating performance on an ongoing basis. Normalized FFO is used by management in evaluating the performance of its core business operations. Items included in calculating FFO that may be excluded in calculating Normalized FFO include certain transaction-related gains, losses, income or expense or other non-core amounts as they occur.
Management believes that AFFO and AFFO per share are also appropriate supplemental measures of a REIT’s operating performance. IIP calculates AFFO by adjusting Normalized FFO for certain cash and non-cash items.
For all periods presented, FFO (diluted), Normalized FFO, AFFO and FFO, Normalized FFO and AFFO per diluted share include the dilutive impact of the assumed full exchange of the Exchangeable Senior Notes for shares of common stock.
For the three months ended March 31, 2023, the performance share units (“PSUs”) granted to certain employees were not included in dilutive securities as the performance thresholds for vesting of the PSUs were not met as measured as of March 31, 2023. For the three months ended March 31, 2022, 102,333 shares issuable upon vesting of the PSUs were dilutive, as the performance thresholds for vesting of these PSUs were met as measured as of March 31, 2022.
IIP’s computation of FFO, Normalized FFO and AFFO may differ from the methodology for calculating FFO, Normalized FFO and AFFO utilized by other equity REITs and, accordingly, may not be comparable to such REITs. Further, FFO, Normalized FFO and AFFO do not represent cash flow available for management’s discretionary use. FFO, Normalized FFO and AFFO should not be considered as an alternative to net income (computed in accordance with GAAP) as an indicator of IIP’s financial performance or to cash flow from operating activities (computed in accordance with GAAP) as an indicator of IIP’s liquidity, nor is it indicative of funds available to fund IIP’s cash needs, including IIP’s ability to pay dividends or make distributions. FFO, Normalized FFO and AFFO should be considered only as supplements to net income computed in accordance with GAAP as measures of IIP’s operations.