![]()
Cronos Group Reports 2022 Third Quarter Results
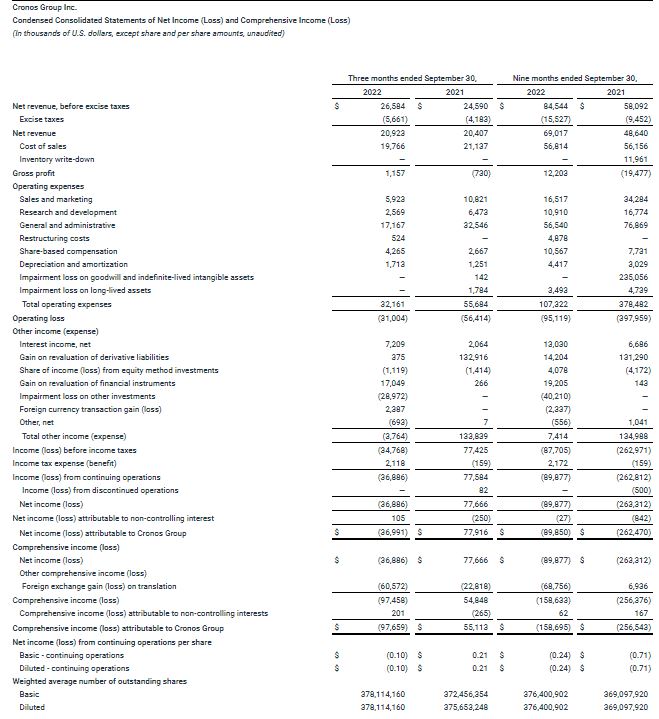
- Reported consolidated net revenue increased 3% year-over-year to $20.9 million; on a constant currency basis, consolidated net revenue increased 7% year-over-year to $21.8 million
- Reported net revenue in Israel increased 88% year-over-year to $7.0 million; on a constant currency basis, net revenue in Israel increased 98% year-over-year to $7.4 million
- SOURZ by Spinach™ Blue-Raspberry Watermelon was the #1 Edible in Canada
- Announces launch of Spinach® Infused pre-rolls
- Jeff Jacobson appointed Chief Growth Officer
TORONTO, Nov. 07, 2022 (GLOBE NEWSWIRE) — Cronos Group Inc. (NASDAQ: CRON) (TSX: CRON) (“Cronos” or the “Company”) today announces its 2022 third quarter business results.
Market share gains through borderless innovation and cost rationalization were key drivers to this quarter’s success. Our award-winning Spinach gummy lineup, such as our SOURZ by Spinach™ Blue-Raspberry Watermelon gummy and new additions to the portfolio including our Spinach FEELZ™ DEEP DREAMZ THC:CBN gummy, continue to win in the category.
 Mike Gorenstein, Chairman, President and CEO, Cronos
Beyond edibles, we achieved new product launches in the vape category powered by rare cannabinoids like CBG and CBN, and in Israel, we continued to grow the PEACE NATURALS® brand with medical patients while expanding our leading position in the country. Looking further ahead, we expect pre-roll innovation to drive our recovery in the category in the fourth quarter and 2023.
“While executing on our innovation pipeline, we also remain on track for the previously announced $20 to $25 million in operating expense savings for 2022,” continued Mr. Gorenstein. “Importantly, we will seek additional opportunities to deliver more efficiencies in 2023. I am proud and grateful for the efforts our global team has put in this year and believe our leaner and more nimble organization provides a strong foundation for us to capitalize on the many growth opportunities ahead.”
Financial Results
Third Quarter 2022
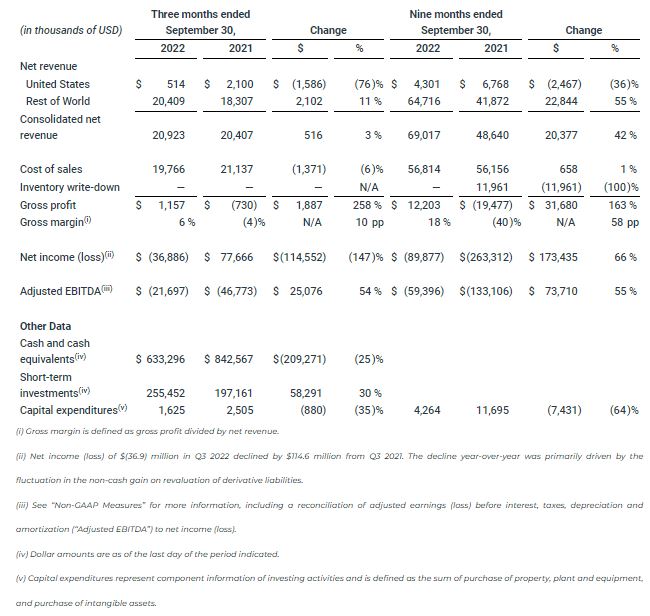
- Net revenue of $20.9 million in Q3 2022 increased by $0.5 million from Q3 2021. The increase year-over-year was primarily driven by an increase in net revenue in the Rest of World (“ROW”) segment driven by growth in the Israeli medical market and higher extract sales in the Canadian adult-use market, partially offset by a reduction in revenue in the U.S. segment, lower cannabis flower sales in the Canadian adult-use market driven by an adverse price/mix shift and the impact of the weakening Canadian dollar against the U.S. dollar during the current period.
- Gross profit of $1.2 million in Q3 2022 improved by $1.9 million from Q3 2021. The improvement year-over-year was primarily driven by increased revenue in the ROW segment, mainly driven by sales of cannabis flower in Israel, a favorable mix of cannabis extract products that carry a higher margin profile than other product categories, and lower cannabis biomass costs. The increases were partially offset by lower fixed cost absorption due to the timing of wind-down activities associated with our planned exit of the Peace Naturals Campus and lower revenue in the U.S. segment.
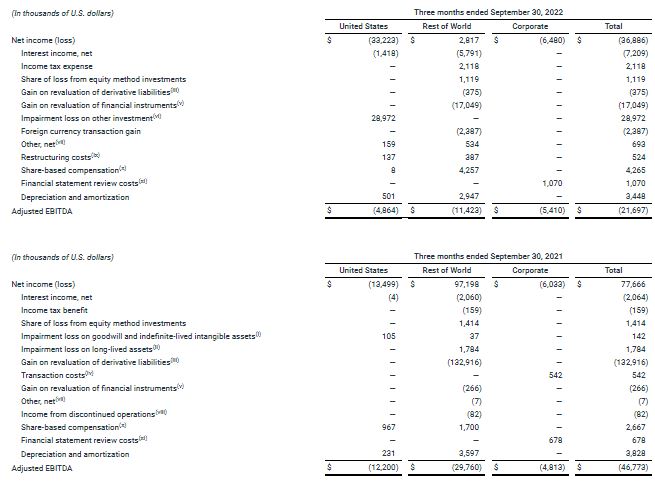
- Adjusted EBITDA of $(21.7) million in Q3 2022 improved by $25.1 million from Q3 2021. The improvement year-over-year was primarily driven by decreases in general and administrative expenses, sales and marketing expenses, and research and development expenses as a result of the Company’s strategic realignment (the “Realignment”) and an improvement in gross profit.
- Capital expenditures of $1.6 million in Q3 2022 decreased by $0.9 million from Q3 2021.
Business Updates
Strategic and Organizational Update
Following the decision to begin a phased exit of the wholesale beauty category in the U.S. business in the second quarter of 2022, the Company continued to reduce operating expenses in the U.S. to better align the business structure with the new strategy to focus on adult-use product formats in the direct-to-consumer channel.
The Company remains on track to achieve the previously identified $20 to $25 million in operating expense savings for 2022, primarily driven by savings in sales and marketing, general and administrative, and research and development.
Brand and Product Portfolio
In the third quarter of 2022 the Spinach® brand continued to organically expand market share in the edibles category in Canada. According to Hifyre data, Spinach® products held an approximate 15.3% market share in the edibles category across Canada, which expands to approximately 19.8% within the gummy category alone during Q3 2022. Furthermore, all four SOURZ by Spinach™ gummies ranked in the top-10 for market share in Canada in Q3 2022 and five out of six of our gummy products available during the quarter across the SOURZ by Spinach™ and Spinach FEELZ™ brands were in the top-15 for the same period.
In the third quarter of 2022, Cronos Israel was awarded a prestigious Clio Award in the Social Good category for the PEACE NATURALS® brand campaign in partnership with the Warriors for Life Association in Israel. The campaign called on mayors to restrict or stop traditional fireworks shows that cause distress and anxiety to medical patients and those with PTSD as a result of conflict and war. The Company is committed supporting and improving the lives of medical patients and veterans utilizing our high-quality differentiated products.
In October, the Company continued to expand its award winning gummy offering with the launch of SOURZ by Spinach™ Tropical Triple Berry 2:1 CBD:THC. This marks Cronos’ first high CBD concentration edible in the Canadian adult-use market for those looking for a more mellow low-dose experience.
In November, Cronos will launch two infused pre-rolls in Canada. The first, under the Spinach® brand is, Fully Charged Atomic GMO, which will be offered in a 5-pack with 0.5 grams per pre-roll. Second, Cronos is launching a CBG-infused pre-roll under the Spinach FEELZ™ brand called, Tropical Diesel CBG, which will be offered in a 3-pack with 0.5 grams per pre-roll.
Global Supply Chain
Cronos Growing Company Inc. (“Cronos GrowCo”) reported to the Company preliminary unaudited net revenue of approximately $5.8 million to licensed producers excluding sales to the Company. Cronos GrowCo continues to build its wholesale customer base and is becoming a meaningful contributor to the Canadian cannabis supply chain.
Cronos Australia declared a one Australian cent per share dividend that resulted in a cash inflow to Cronos of $390,000 in October 2022. Cronos Australia continues to execute against its growth initiatives and we are pleased to see this investment bring cash back to Cronos.
Appointments
In October, Jeff Jacobson was appointed Chief Growth Officer. Mr. Jacobson previously served as the Company’s Senior Vice President, Head of Growth (North America). Mr. Jacobson has been with Cronos since December 2016 and was a co-founder of Peace Naturals Project Inc. Mr. Jacobson’s expertise and experience in licensing and compliance, new business development, project management and resource management assist Cronos in developing and penetrating domestic and international markets.
Rest of World Results
Cronos’ ROW reporting segment includes results of the Company’s operations for all markets outside of the U.S.
Third Quarter 2022
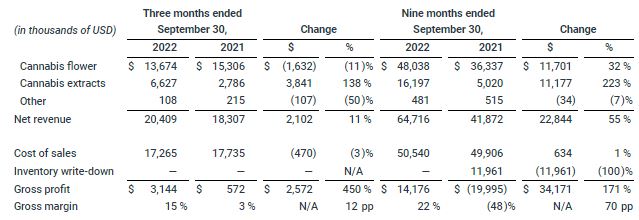
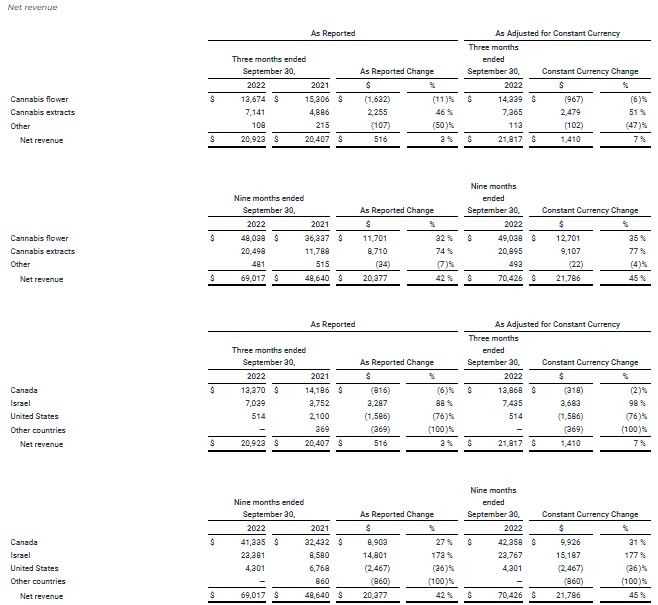
- Net revenue of $20.4 million in Q3 2022 increased by $2.1 million from Q3 2021. The increase year-over-year was primarily driven by an increase in net revenue in the Israeli medical market largely attributable to the cannabis flower category, and higher cannabis extract sales in the Canadian adult-use market, partially offset by lower cannabis flower sales in Canada driven by an adverse price/mix shift and the impact of the weakening Canadian dollar against the U.S. dollar during the current period.
- Gross profit of $3.1 million in Q3 2022 improved by $2.6 million from Q3 2021. The improvement year-over-year was primarily driven by increased cannabis flower revenue in Israel, and higher cannabis extract sales in Canada, which carry a higher gross margin than other product categories and lower cannabis biomass costs, partially offset by lower fixed cost absorption due to the timing of wind down activities associated with our planned exit of the Peace Naturals Campus.
United States Results
Cronos’ U.S. reporting segment includes results of the Company’s operations for all brands and products in the U.S.
Third Quarter 2022
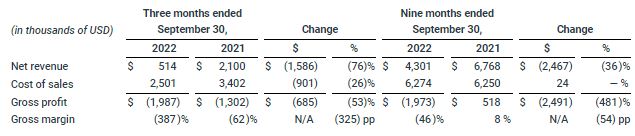
- Net revenue of $0.5 million in Q3 2022 decreased by $1.6 million from Q3 2021. The decrease year-over-year was primarily driven by a reduction in sales as a result of a decrease in promotional spending and SKU rationalization efforts as the Company implements the Realignment with respect to the U.S. segment.
- Gross profit of $(2.0) million in Q3 2022 decreased by $0.7 million from Q3 2021. The decrease year-over-year was primarily due to lower sales volumes and increased inventory reserves.
Conference Call
The Company will host a conference call and live audio webcast on Monday, November 7, 2022, at 8:30 a.m. ET to discuss 2022 Third Quarter business results. An audio replay of the call will be archived on the Company’s website for replay. Instructions for the live audio webcast are provided on the Company’s website at https://ir.thecronosgroup.com/events-presentations.
About Cronos
Cronos is an innovative global cannabinoid company committed to building disruptive intellectual property by advancing cannabis research, technology and product development. With a passion to responsibly elevate the consumer experience, Cronos is building an iconic brand portfolio. Cronos’ diverse international brand portfolio includes Spinach®, PEACE NATURALS®, Lord Jones®, Happy Dance® and PEACE+®. For more information about Cronos and its brands, please visit: thecronosgroup.com.
Non-GAAP Measures
Cronos reports its financial results in accordance with Generally Accepted Accounting Principles in the United States (“U.S. GAAP”). This press release refers to measures not recognized under U.S. GAAP (“non-GAAP measures”). These non-GAAP measures do not have a standardized meaning prescribed by U.S. GAAP and are therefore unlikely to be comparable to similar measures presented by other companies. Rather, these non-GAAP measures are provided as a supplement to corresponding U.S. GAAP measures to provide additional information regarding the results of operations from management’s perspective. Accordingly, non-GAAP measures should not be considered a substitute for, or superior to, the financial information prepared and presented in accordance with U.S. GAAP. All non-GAAP measures presented in this press release are reconciled to their closest reported U.S. GAAP measure. Reconciliations of historical adjusted financial measures to corresponding U.S. GAAP measures are provided below.
Adjusted EBITDA
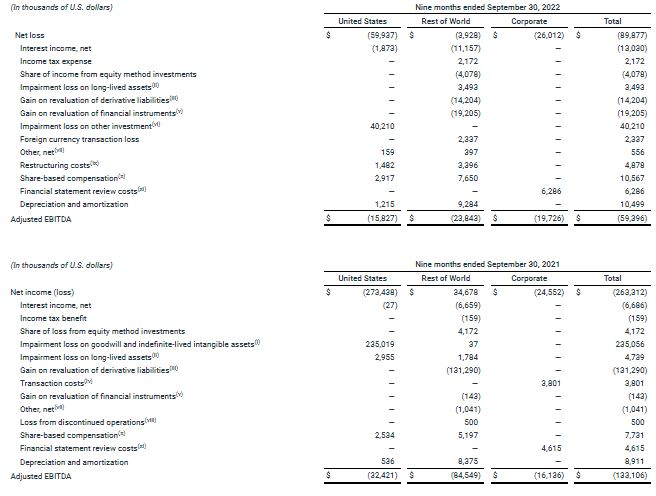
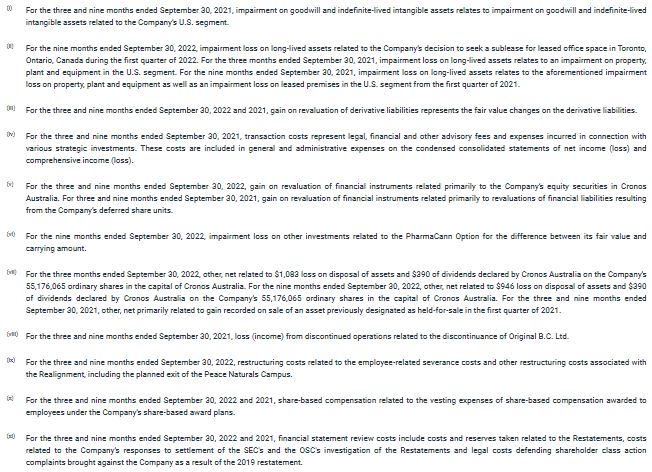
Management reviews Adjusted EBITDA, a non-GAAP measure, which excludes non-cash items and items that do not reflect management’s assessment of ongoing business performance of our operating segments. Management defines Adjusted EBITDA as net income (loss) before interest, tax expense (benefit), depreciation and amortization adjusted for: share of income (loss) from equity method investments; impairment loss on goodwill and intangible assets; impairment loss on long-lived assets; (gain) loss on revaluation of derivative liabilities; (gain) loss on revaluation of financial instruments; transaction costs related to strategic projects; impairment loss on other investments; foreign currency transaction loss; other, net; loss from discontinued operations; restructuring costs; share-based compensation; and financial statement review costs and reserves related to the restatements of the Company’s 2019 and 2021 interim financial statements (the “Restatements”), including the costs related to the settlement of the SEC’s and the OSC’s investigation of the Restatements and legal costs defending shareholder class action complaints brought against the Company as a result of the 2019 restatement.
Management believes that Adjusted EBITDA provides the most useful insight into underlying business trends and results and provides a more meaningful comparison of period-over-period results. Management uses Adjusted EBITDA for planning, forecasting and evaluating business and financial performance, including allocating resources and evaluating results relative to employee compensation targets.
The following tables set forth a reconciliation of Net income (loss) as determined in accordance with U.S. GAAP to Adjusted EBITDA for the periods indicated:
Constant Currency
To supplement the consolidated financial statements presented in accordance with U.S. GAAP, we have presented constant currency adjusted financial measures for net revenues, gross profit, gross profit margin, operating expenses, net income (loss) and adjusted EBITDA for the three and nine months ended September 30, 2022 as well as cash and cash equivalents and short-term investment balances as of September 30, 2022 compared to December 31, 2021, which are considered non-GAAP financial measures. We present constant currency information to provide a framework for assessing how our underlying operations performed excluding the effect of foreign currency rate fluctuations. To present this information, current and comparative prior period income statement results in currencies other than U.S. dollars are converted into U.S. dollars using the average exchange rates from the three- and nine-month comparative periods in 2021 rather than the actual average exchange rates in effect during the respective current periods; constant currency current and prior comparative balance sheet information is translated at the prior year-end spot rate rather than the current period spot rate. All growth comparisons relate to the corresponding period in 2021. We have provided this non-GAAP financial information to aid investors in better understanding the performance of our segments. The non-GAAP financial measures presented in this press release should not be considered as a substitute for, or superior to, the measures of financial performance prepared in accordance with U.S. GAAP.
The table below sets forth certain measures of consolidated results from continuing operations on a constant currency basis for the three and nine months ended September 30, 2022 compared to the three and nine months ended September 30, 2021 as well as cash and cash equivalents and short-term investments as of September 30, 2022 and December 31, 2021, both on an as-reported and constant currency basis (in thousands):
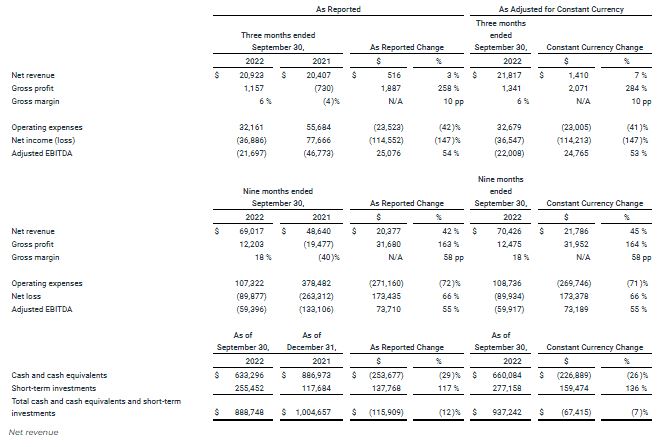
For the three months ended September 30, 2022, net revenue on a constant currency basis was $21.8 million, representing a 7% increase from the three months ended September 30, 2021. For the nine months ended September 30, 2022, net revenue on a constant currency basis was $70.4 million, representing a 45% increase from the nine months ended September 30, 2021. Net revenue increased for both the three and nine months ended September 30, 2022 on a constant currency basis and was primarily due to higher cannabis flower sales in the Israeli medical market and higher cannabis extract sales in the Canadian adult-use market, partially offset by a reduction in revenue in the U.S. segment and lower cannabis flower sales in the Canadian adult-use market driven by an adverse price/mix shift.
Gross profit
For the three months ended September 30, 2022, gross profit on a constant currency basis was $1.3 million, representing a 284% increase from the three months ended September 30, 2021. For the nine months ended September 30, 2022, gross profit on a constant currency basis was $12.5 million, representing a 164% increase from the nine months ended September 30, 2021. For the three-month comparative period, the change was primarily due to increased revenue in the ROW segment driven mainly by sales of cannabis flower in Israel and a favorable mix of cannabis extract products, which carry a higher gross profit and gross margin than other product categories, and lower cannabis biomass costs, partially offset by lower fixed cost absorption due to the timing of wind-down activities associated with our planned exit of the Peace Naturals Campus and lower revenue in the U.S. segment. For the nine-month comparative period, the change was primarily due to increased revenue in the ROW segment driven mainly by sales of cannabis flower in Israel and a favorable mix of cannabis extract products, which carry a higher gross profit and gross margin than other product categories, the absence of inventory write-downs in the current period, and lower cannabis biomass costs, partially offset by lower fixed cost absorption due to the timing of wind-down activities associated with our planned exit of the Peace Naturals Campus and lower revenue in the U.S. segment.
Operating expenses
For the three months ended September 30, 2022, operating expenses on a constant currency basis was $32.7 million, representing a 41% decrease from the three months ended September 30, 2021. For the nine months ended September 30, 2022, operating expenses on a constant currency basis was $108.7 million, representing a 71% decrease from the nine months ended September 30, 2021. On a constant currency basis, operating expenses decreased for both the three and nine months ended September 30, 2022 primarily due to lower advertising and marketing spend and lower payroll-related costs in the U.S. segment as a result of the Realignment, reduced costs associated with the timing of Ginkgo milestones and a cancellation of beauty-focused product development spending in the U.S. segment as well as an expected credit loss allowance revaluation recognized in the three- and nine-month comparative periods, partially offset by higher restructuring costs related to the Realignment, including the planned exit of the Peace Naturals Campus.
Net income (loss)
For the three months ended September 30, 2022, net loss on a constant currency basis was $36.5 million, representing a 147% reduction in net income from the three months ended September 30, 2021. For the nine months ended September 30, 2022, net loss on a constant currency basis was $89.9 million, representing a 66% improvement from the nine months ended September 30, 2021.
Adjusted EBITDA
For the three months ended September 30, 2022, Adjusted EBITDA on a constant currency basis was $(22.0) million, representing a 53% improvement from the three months ended September 30, 2021. For the nine months ended September 30, 2022, Adjusted EBITDA on a constant currency basis was $(59.9) million, representing a 55% improvement from the nine months ended September 30, 2021. The improvement in Adjusted EBITDA for both the three and nine months ended September 30, 2022 on a constant currency basis was primarily driven by decreases in general and administrative expenses, sales and marketing expenses, and research and development expenses as a result of the Company’s strategic Realignment and an improvement in gross profit.
Cash and cash equivalents & short-term investments
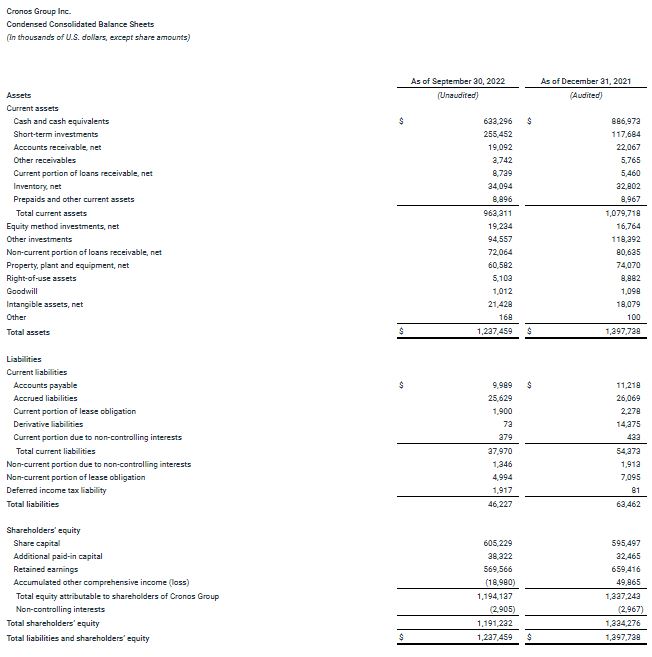
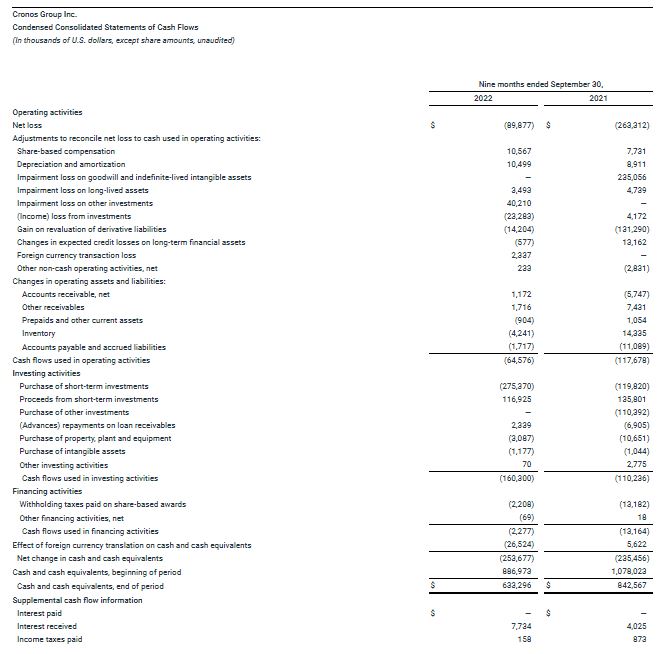
Cash and cash equivalents and short-term investments on a constant currency basis decreased 7% to $937.2 million as of September 30, 2022 from $1.0 billion as of December 31, 2021. The decrease in cash and cash equivalents and short-term investments is primarily due to cash flows used in operating activities in 2022.
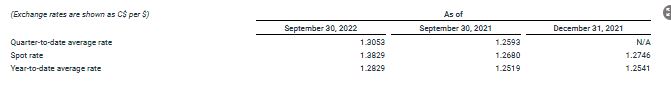
Foreign currency exchange rates
All currency amounts in this press release are stated in U.S. dollars (“USD”), which is our reporting currency, unless otherwise noted. All references to “dollars” or “$” are to USD. The assets and liabilities of the Company’s foreign operations are translated into USD at the exchange rate in effect as of September 30, 2022, September 30, 2021 and December 31, 2021. Transactions affecting shareholders’ equity are translated at historical foreign exchange rates. The consolidated statements of net income (loss) and comprehensive income (loss) and the consolidated statements of cash flows of the Company’s foreign operations are translated into USD by applying the average foreign exchange rate in effect for the reporting period using Bloomberg.
The exchange rates used to translate from USD to Canadian dollars (“C$”) is shown below: