 GrowGeneration Reports Record FY 2017 Revenue
FY 2017 Revenue up 80% to $ 14.4 million; Same-store sales increase 35%
2018 Revenue Guidance Set at $37 million
DENVER, March 28, 2018 /PRNewswire/ – GrowGeneration Corp. (OTCQX: GRWG), (“GrowGen” or the “Company”) one of the largest specialty retail hydroponic and organic gardening stores, selling to both the commercial and home cannabis markets, with 15 current locations (13 locations as of December 31, 2017), today reported financial results for its fiscal year ended December 31, 2017.
Fiscal Year 2017 Financial Highlights:
- Revenue of $14.4 million, up 80% compared to revenue of $8 million for 2016
- Same-Store Sales increased 35% from $6.4 million for 2016 compared to $8.6 million for FY 2017
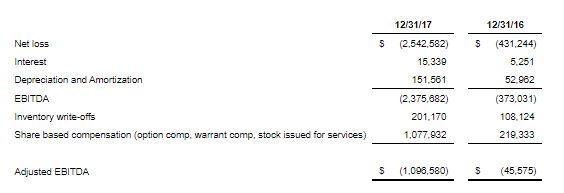
- Adjusted EBITDA for the year ended December 31, 2017 totaled $(1,096,580) compared to adjusted EBITDA of $(45,575) for the year ended December 31, 2016
- The Company had $1.2 million in cash as of December 31, 2017, $8.0 million at March 23, 2018
- As of December 31, 2017, the Company had $5.6 million in working capital compared to $2.8 million in working capital as of December 31, 2016.
- The Company raised $5.2 million in equity capital for the year ended December 31, 2017 through the issuance of common stock and the exercise of warrants.
- 2018 Revenue guidance set at $37 Million
This was a great year for sales for GrowGeneration, clearly demonstrating the demand for our products and the scalability of our business as we continue our expansion plans. We have a robust pipeline of acquisitions, that we plan to close in the first half of the year. With revenue guidance set at $37M, we anticipate continued growth into 2018 and 2019.
 Darren Lampert, Co-Founder and CEO
Our company continues to attract capital, raising $5.2 million in 2017, strengthening our balance sheet to $9.2 million in assets and breaking the $14 million revenue mark. GrowGen now is operating in 5 states, with 15 commercial and retail stores, with over 50,000 sq. ft. and servicing 100’s of licensed commercial growers. We are aggressively expanding our brand and acquisitions model, with a focus in California, Nevada, Michigan, Rhode Island, Massachusetts, Maine, Oregon, and the state of Washington.
Fiscal Year 2017 Financial Results:
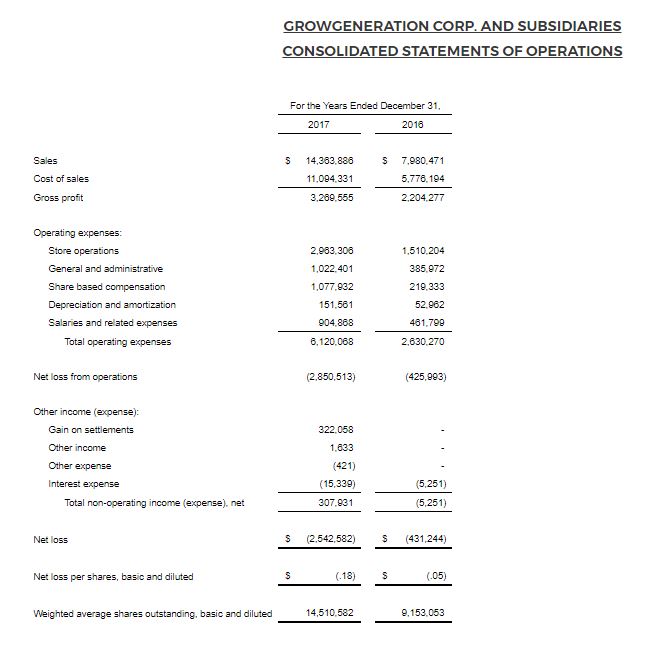
Revenues for the year ended December 31, 2017 increased 80% to $14.4 million, compared to $8 million for the year ended December 31, 2016.
In October 2017, our Santa Rosa store was forced to close for 17 days due to wildfires in the Santa Rosa area. We estimate that the Company’s loss of revenue for that period was approximately $120,000. In addition, revenue subsequent to when the store reopened, October 26, 2017, were lower than the months prior to the fire by approximately $100,000 a month.
Same Store Sales:
The Company had the same 7 stores opened for the entire year ended December 31, 2017 and 2016. These same stores generated $8.6 million in sales for the year ended December 31, 2017, compared to $6.4 million in sales for the same period ended December 31, 2016, an increase of 35%. The other Company stores, which were open for only a portion of 2017, generated $5.8 million in sales in 2017 and $1.6 million in sales in 2016.
Cost of Goods Sold
Cost of goods sold for the year ended December 31, 2017 increased approximately $5.3 million, to $11.1 million an increase of 92%, as compared to $5.8 million for the year ended December 31, 2016. The increase in cost of goods sold was primarily due to the 80% increase in sales comparing the year ended December 31, 2016 to 2017.
Gross profit was $3.3 million for the year ended December 31, 2017, as compared to $2.2 million for the year ended December 31, 2016, an increase of approximately $1.1 million or 48%. Gross profit as a percentage of sales was 23% for the year ended December 31, 2017, compared to 28% for the year ended December 31, 2016. The decrease in the gross profit percentage is partially due to the opening of a new stores in Las Vegas, NV on January 2017, San Bernardino, CA and Seattle, WA in mid-May 2017 and Boulder CO in September 2017 and the initial product discounting to attract new customers to that location. The primary reason for the reduction in the gross margin % was a non-cash write of inventory of approximately $463,000 in the fourth quarter of 2017 whose impact was to reduce the gross margin % by 3.4%. The inventory write-off consists of obsolete inventory as part of the purchase price of stores acquired and believes that this write-off is one-time event.
Operating Expenses
Operating expenses are comprised of store operations, primarily payroll, rent and utilities, and corporate overhead. Store operating costs were approximately $2.9 million for the year ended December 31, 2017 and approximately $1.5 million for the year ended December 31, 2016, an increase of approximately $1.4 million or 96%. The increase in store operating cost was due to addition of five locations that were not open in 2016. Store operating costs as a percentage of sales were 21% for the year ended December 31, 2017 compared to 19% for the year ended December 31, 2016. As previously noted above, we opened five locations in 2017 that were not open at all in 2016 and as such, store operating costs will be higher as the stores ramp up in sales which can take several months. Corporate overhead is comprised of share based compensation, depreciation and amortization, general and administrative costs and corporate salaries and related expenses and were approximately $3.2 for the year ended December 31, 2017 compared to approximately $1.1 million for the year ended December 31, 2016. The increase in salaries and related expense from 2016 to 2017 was due to the increase in corporate staff, primarily, accounting and finance, inventory management, sales and information technology, to support both current and future operations and to increase outside sales. Corporate salaries as a percentage of sales were 6.3% for the year ended December 31, 2017 and 5.8% for the year ended December 31, 2016. The slight increase in this percentage is because corporate staff costs do not rise directly commensurate with the increase in revenues. In addition, current corporate staff levels will not rise commensurate with increase in revenues in the future and the percentage of salaries to sales will decline. General and administrative expenses, comprised mainly of advertising and promotions, professional fees and insurance, were approximately $1 million for the year ended December 31, 2017 and approximately $386,000 for the year ended December 31, 2016 with a majority of the increase in advertising and promotion and travel and entertainment. General and administrative costs as a percentage of revenue was 7.1% for the year ended December 31, 2017 compared to 4.8% for the year ended December 31, 2016.
The slight increase in the percentage comparing 2016 to 2017 was primarily due to an increase in advertising and promotion expenses from approximately $108,000 in 2016 to approximately $265,000 for 2017, which was mainly due to new store promotional costs in 2017 and increase in professional fees from approximately $58,000 for the year ended December 31, 2016 to approximately $630,000 for the year ended December 31, 2017. Professional fees for 2017 included $184,000 in noncash share-based compensation. Corporate overhead includes non-cash expenses, consisting primarily of depreciation and share-based compensation, which was approximately $1.1 million for the year ended December 31, 2017, compared to approximately $219,000 for the year ended December 31, 2016. Corporate overhead costs were 22% of revenue for the year ended December 31, 2017 compare to 14% for the year ended December 31, 2016, due to the reason noted above.
Net Income (Loss)
The net loss for the year ended December 31, 2017 was approximately $2.5 million compared to approximately $431,000 for the year ended December 31, 2016, an increase in the net loss of $2.1 million. Adjusted EBITDA for the year ended December 31, 2017 totaled $(1,069,580) compared to adjusted EBITDA of $(45,575) for the year ended December 31, 2016. The increase in the net loss was primarily due to 1) an increase in non-cash shares-based compensation of approximately $636,000, 2) increases in other operating costs such as G&A and salaries, 3) the opening of our operations in Denver and Boulder, CO, Las Vegas and Las Vegas North, NV, and San Bernardino, CA, 4) costs related to the Seattle Hydro purchase and pre-opening store costs, 5), a decrease in the gross profit percentage as noted above, offset somewhat by the increase on gross profit.
Balance Sheet Summary
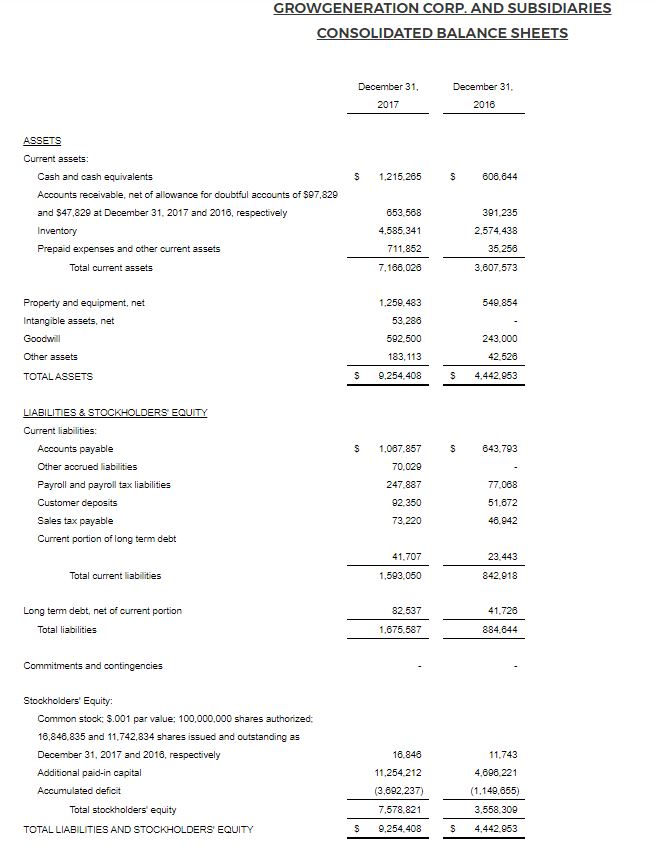
As of December 31, 2017, the Company had $1.2 million in cash and $7.2 million in total current assets and $5.6 in working capital compared with $606,000, $3.6 million and $2.8 million, respectively, as of December 31, 2016. Current liabilities were $1.6 million at December 31, 2017, compared to $843,000 at December 31, 2016. The Company raised $5.2 million in equity capital during the year ended December 31, 2017 through the issuance of common stock and the exercise of warrants.
Adjusted EBITDA for the year ended December 31, 2017 totaled $(1,096,580) compared to adjusted EBITDA of $(45,575) for the year ended December 31, 2016 (see definition and further discussion about the presentation of a EBITDA, a non-GAAP term, below).
Use of Non-GAAP Financial Information
The Company believes that the presentation of results excluding certain items in “Adjusted EBITDA,” such as non-cash equity compensation charges, provides meaningful supplemental information to both management and investors, facilitating the evaluation of performance across reporting periods. The Company uses these non-GAAP measures for internal planning and reporting purposes. These non-GAAP measures are not in accordance with, or an alternative for, generally accepted accounting principles and may be different from non-GAAP measures used by other companies. The presentation of this additional information is not meant to be considered in isolation or as a substitute for net income or net income per share prepared in accordance with generally accepted accounting principles.
About GrowGeneration Corp.:
GrowGeneration Corp. (“GrowGen”) owns and operates specialty retail hydroponic and organic gardening stores. Currently, GrowGen has 15 stores, which includes 8 locations in Colorado, 3 locations in California, 2 locations in Las Vegas, 1 location in Washington and 1 location in Rhode Island. GrowGen carries and sells thousands of products, including organic nutrients and soils, advanced lighting technology and state of the art hydroponic equipment to be used indoors and outdoors by commercial and home growers. Our mission is to own and operate GrowGeneration branded stores in all the major legalized cannabis states. Management estimates that roughly 1,000 hydroponic stores are in operation in the U.S. By 2020 the market is estimated to reach over $23 billion with a compound annual growth rate of 32%.
 Original Press Release