HEXO reports fiscal 2018 fourth quarter results
GATINEAU, Quebec, Oct. 26, 2018 (GLOBE NEWSWIRE) — HEXO Corp. (TSX:HEXO) (the “Company”) reported its financial results for the three and twelve months ended July 31, 2018, the fourth quarter of the 2018 fiscal year. The management discussion and analysis for the period and the accompanying financial statements and notes are available under the Company’s profile on SEDAR at www.sedar.com and on its website at ir.hexo.com. All amounts are expressed in Canadian dollars and results pertain to a period pre-legalization for the adult-use cannabis market.
Corporate Highlights
- Formation of the joint venture ‘Truss’ with Molson Coors Canada to pursue opportunities to develop non-alcoholic, cannabis-infused beverages for the Canadian market
- Supply agreements with the Ontario Cannabis Store and the British Columbia Liquor Distribution Board to supply the award-winning sublingual mist Elixir products, as well as Fleur de Lune, an intimate cannabis oil, in Ontario
- First global foray with partnership with Greek company Qannabos and plans to establish a Eurozone processing, production and distribution centre in Greece, including the development of 350,000 sq. ft. of licensed infrastructure
- First harvests from new 250,000 sq. ft. greenhouse, increasing annual production capacity to 25,000 kg of dried flower
- Foundation and framing for the 1,000,000 sq. ft. greenhouse completed (completion remains on track for December 2018)
- Acquisition of an interest in a 2,004,000 sq. ft. facility in Belleville, Ontario, providing capacity for the manufacturing of advanced cannabis products
- Contract with Metro Supply Chain Group contract to manage a warehouse and distribution centre for Quebec adult-use webstore orders for the Société québécoise du cannabis (“SQDC”) in modern 58,000 sq. ft. facility located in Montreal
- Strategic investment of $10 million in the independent corporate cannabis retailer Fire and Flower Inc., through a convertible note receivable
Financial Highlights
- Revenue per gram increased to $9.26 per gram equivalent from $9.24 in the prior quarter, and $9.00 in the fourth quarter of fiscal 2017
- Revenue increased 14% to $1,410,656 quarter over quarter and the volume of cannabis dried grams and gram equivalents sold increased 13% to 152,288 from the third quarter of fiscal 2018
- Ontario-based sales increased 15% during the quarter ended July 31, 2018
- Weighted average cash cost of dried inventory sold per gram of $0.90 held relatively steady from $0.88 per gram in the third quarter of fiscal 2018 and decreased 14% year-over-year compared to the fourth quarter of fiscal 2017
- Cash and short-term investments were $244.8 million as at July 31, 2018, and the balance sheet remained debt-free
The past quarter has signified many milestones for HEXO Corp as we moved towards final preparations for the adult-use cannabis market. With two additional supply deals, this time in Ontario and in British Columbia, the establishment of a joint venture with Molson Coors Canada to develop cannabis-infused non-alcoholic beverages, a first step towards going global, and more, I’m extremely proud of the speed at which we continue to execute on our strategic priorities.
 Sebastien St-Louis, HEXO’s CEO and co-founder
Fourth Quarter 2018 Results
Summary of results for the three- and twelve-month periods ended July 31, 2018 and July 31, 2017 (in thousands of Canadian dollars, except share and per share amounts, and where otherwise noted)
Summary of results for the three- and twelve-month periods ended July 31, 2018 and July 31, 2017
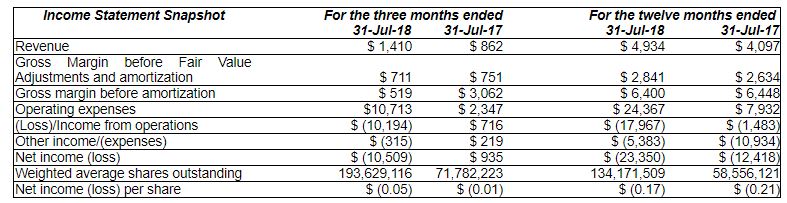
* As a result of a business combination completed on March 15, 2017, pre-consolidation THCX shares were exchanged at a rate of six to one. Shares after this date have been stated using post-consolidation figures. (See Note 4 to the consolidated financial statements for the year ended July 31, 2018.)
Revenue
Revenue for the fourth quarter ended July 31, 2018 increased 64% to $1,410 compared to $862 in the same period in Fiscal 2017. Higher revenue was driven mainly by increased Elixir and H2 (mid-range line) sales volume, as Elixir was introduced in late Q4’17 and H2 sales volume increased by 70%. Compared to the prior quarter, the sequential revenue increase was 14%, reflecting a higher total of volume sold, primarily driven by a 31% increase in oil sales.
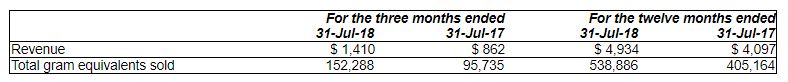
Sales volume increased 59% to 152,288 gram equivalents, compared to 95,735 in the same prior year period, due to an increase in our oil based products as the product mix purchased by customers shifted towards smoke free alternatives. Total dried grams sold increased 33%. Revenue per gram equivalent increased to $9.26 as compared to $9.00 in the same prior year period, mainly as a result of higher sales of our Elixir product line, which contributes a higher revenue per gram equivalent than dried product.
On a sequential basis, sales volume increased 14% compared to the third quarter of Fiscal 2018, essentially for the same reasons as noted above.
For the twelve months ended July 31, 2018, revenue increased 20% to $4,934 compared to $4,097 in the same period in Fiscal 2017. Sales volume increased 33% to 538,886 gram equivalents, compared to 404,158 in the same prior year period.
Cost of Sales
Cost of goods sold includes the direct costs of materials and labour related to inventory sold, and includes harvesting, processing, packaging and shipping costs.
Fair value adjustment on sale of inventory includes the fair value of biological assets included in the value of inventory transferred to cost of sales.
Fair value of biological assets represents the increase or decrease in fair value of plants during the growing process less expected cost to complete and selling costs and includes certain management estimates.
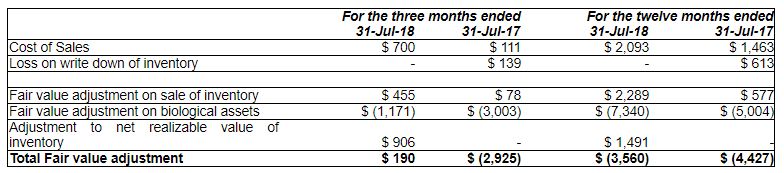
Cost of sales for the quarter ended July 31, 2018 were $700, compared to $111 for the same quarter ended July 31, 2017. Included in the cost of sales for the quarter ended July 31, 2017 is the $139 write down of inventories due to the Company’s voluntary recall in May 2017, and water damaged inventory which when excluded yields additional cost of sales of $613 for the twelve months ended July 31, 2017. The increase in cost of sales is the result of increased sales volumes and an increase to transformation, packaging and shipping costs.
Fair value adjustment on the sale of inventory for the fourth quarter ended July 31, 2018 was $455 compared to $78 for the same quarter ended July 31, 2017. This is due to the increase in production scale and total sales. The adjustment to net realizable value of inventory increased from the same quarter ended July 31, 2017 to $906 due to the decrease in the estimated market selling price input of inventory valuation. This is due to the onset of the adult-use market and reflects competitive market prices. The increase in the twelve months ended July 31, 2018 adjustment of $1,491 is also due to the above.
Fair value adjustment on biological assets for the fourth quarter ended July 31, 2018 was ($1,171) compared to ($3,003) for the same quarter ended July 31, 2017. This is due to a significant decrease in the average dried gram market selling price input due to the onset of the adult-use market. This decrease is offset by the increase in the total number of plants as the first harvests of the B6 greenhouse began in July 2018. The increase scale and total plants on hand is the result of preparing for the adult-use market which began October 17, 2018.
Weighted average cash cost of dried inventory sold per gram (a non-IFRS measure)
Weighted average cash cost of dried inventory sold per gram includes direct costs associated with the growing, harvesting and processing of inventory sold such as labour, utilities, fertilizer costs, biological control costs, general supplies and materials, curing, milling, quality assurance and testing, of inventory sold in the period.
As there are no standardized methods of calculating this non-IFRS measure, our methods may differ from those used by others, and accordingly, the use of this measure may not be directly comparable to similarly titled measures used by others. Accordingly, these non-IFRS measures are intended to provide additional information and should not be considered in isolation or as a substitute for measures of performance prepared in accordance with IFRS.
Weighted average cash cost of dried inventory sold is calculated as follows:
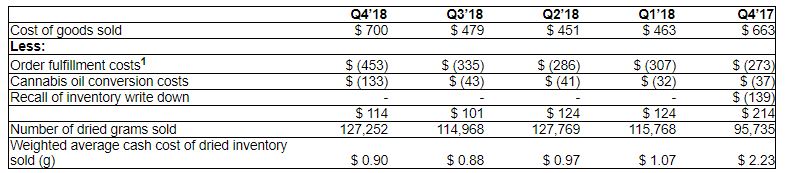
1 Order fulfilment costs are excluded from the calculation of weighted average cash cost of dried inventory sold as this non-IFRS metric is utilized to demonstrate the burdened cash cost of producing, cultivating and bringing a gram of dried inventory to the state of a finished good to be sold during the period.
Weighted average cash cost of dried inventory sold per gram declined 60% year over year to $0.90 for the fourth quarter ended July 31, 2018, compared to $2.23 for the same prior year quarter. Cost per grams sold has been trending downward cumulatively as a result of improvements in the cultivation processes and economies of scale resulting from the full utilization of a higher production capacity.
The weighted average cash cost of dried inventory sold slightly increased to $0.90 from $0.88 as compared to the 3 months quarter ended April 30, 2018. This trend is expected to continue in the short-term, as the Company moves towards full efficiencies of scale and utilization of the new facilities as well as begins increased levels of production to meet the demand of the adult recreational market.
During the prior year quarter ended July 31, 2017, the Company recorded a write-down of inventories related to the Company’s voluntary recall and water damaged goods.
Operating Expenses
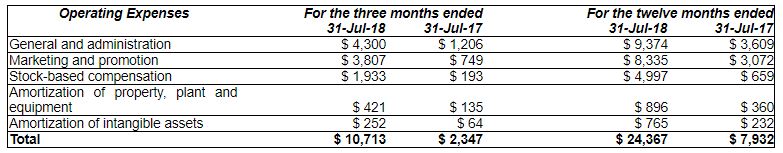
Operating expenses include marketing and promotion, general and administrative, research and development, stock-based compensation, and amortization expenses. Marketing and promotion expenses include customer acquisition costs, customer experience costs, salaries for marketing and promotion staff, general corporate communications expenses and research and development costs. General and administrative expenses include salaries for administrative staff and executive salaries as well as general corporate expenditures including legal, insurance and professional fees.
General and Administrative
General and administrative expenses increased to $4,300 in the fourth quarter, compared to $1,206 for the same period in Fiscal 2017. This increase reflects the general growing scale of our operations, including an increase in general, finance and administrative staffing and additional rental space. Consulting and professional fees increased by $1,775 and $207 respectively, this reflective of the increased financial reporting and control based regulatory requirements accompanying public status on the TSX-V and subsequently the TSX as well as increased compliance costs as a publicly listed company.
For the twelve months ended July 31, 2018, general and administrative expenses increased to $9,374 compared to $3,609 for the same period in Fiscal 2017. The increase is consistent with the explanation as stated above.
Marketing and promotion
Marketing and promotion expenses increased to $3,807 in the fourth quarter, compared to $749 for the same period in Fiscal 2017. This primarily reflects additional marketing and promotional events undertaken in the quarter as we build brand recognition and establish HEXO in the recreational cannabis market. This is inclusive of higher staff and travel-related expenses, printing and promotional materials as well as advertisement costs. This is consistent with our focus to prepare for the legalization of the adult recreational market.
For the twelve months ended July 31, 2018, marketing and promotion expenses increased to $8,335, compared to $3,072 for the same period in Fiscal 2017. The increase is consistent with the explanation as stated above.
Amortization of property, plant and equipment
Amortization of property, plant and equipment increased to $421 in the fourth quarter, compared with $135 for the same period in Fiscal 2017. The increase is the direct result of the Company’s newly built greenhouses and cultivation equipment becoming operational. Additionally, increases to cultivation and production equipment were incurred in order to support the larger production demands.
For the twelve months ended July 31, 2018, property, plant and equipment depreciation expenses increased to $896, compared to $360 for the same period in Fiscal 2017. The increase is consistent with the explanation as stated above.
Amortization of intangible assets
Amortization of intangible assets increased to $252 in the fourth quarter, compared with $64 for the same period in Fiscal 2017. The increase is the result of a change in the expected useful life of certain software as we prepared for the implementation of a new ERP system, which will replace certain software programs we currently use and the establishment of an online sales platform.
For the twelve months ended July 31, 2018, intangible asset depreciation expenses increased to $765, compared to $232 for the same period in Fiscal 2017. The increase is consistent with the explanation as stated above.
Loss from Operations
Income/(loss) from operations for the fourth quarter was ($10,194), compared to $716 for the same period in Fiscal 2017. The increased loss from operations is due mainly to higher expenses in line with the expanding scale of operations as we prepare for the legalization of the adult recreational market.
For the twelve months ended July 31, 2018, loss from operations was ($17,967), compared to ($1,483) in the same prior year period for the same reasons as the change for the three-month period.
Other Income/Expenses
Other income/(expense) was ($315) and ($5,383) for the three and twelve months ended July 31, 2018 ($219 and ($10,934) for the three and twelve months ended July 31, 2017 respectively). Revaluation of financial instruments of ($5,091) in the latest quarter reflects the revaluation of an embedded derivative related to $3,275 of USD convertible debentures issued and converted in the prior year. Additionally, we incurred interest income for the three months ended July 31, 2018 and July 31, 2017 of $854 and $61, respectively. Interest expenses of $Nil and $75 were realized for the three months ended July 31, 2018 and July 31, 2017 respectively. This increase reflects the interest generated from the acquired short-term investments during the quarter ended July 31, 2018.
About HEXO Corp.
HEXO Corp. creates and distributes innovative, easy-to-use and easy-to-understand products to serve the Canadian cannabis market. One of the country’s lowest-cost producers, HEXO is rapidly increasing its production capacity in the lead up to the adult-use cannabis market. The Company currently operates with over 310,000 sq. ft. of production capacity with construction on another 1,000,000 sq. ft. expansion set to be complete by year end. HEXO will serve the adult-use market under the HEXO brand, while continuing to serve its medical cannabis clients through the well-known Hydropothecary brand.