![]()
Hydrofarm Holdings Group Announces First Quarter 2023 Results
SHOEMAKERSVILLE, Pa., May 10, 2023 (GLOBE NEWSWIRE) — Hydrofarm Holdings Group, Inc. (“Hydrofarm” or the “Company”) (Nasdaq: HYFM), a leading independent manufacturer and distributor of branded hydroponics equipment and supplies for controlled environment agriculture, today announced financial results for its first quarter ended March 31, 2023.
First Quarter 2023 Highlights vs. Prior Year Period:
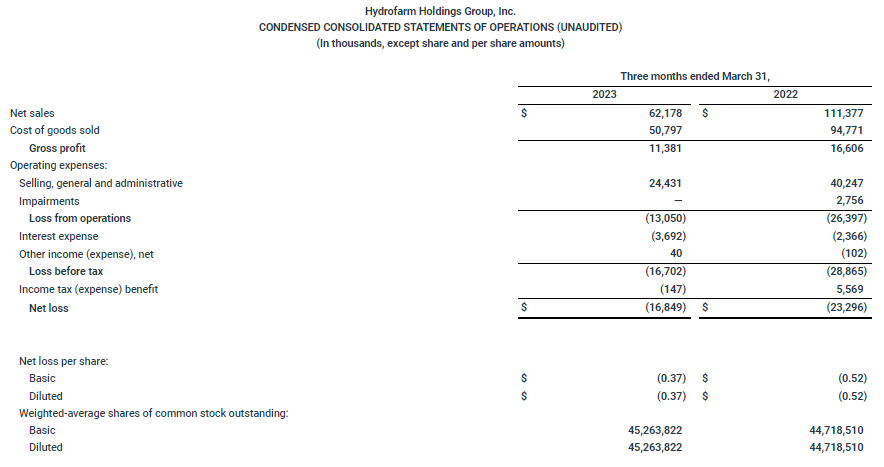
- Net sales decreased to $62.2 million compared to $111.4 million.
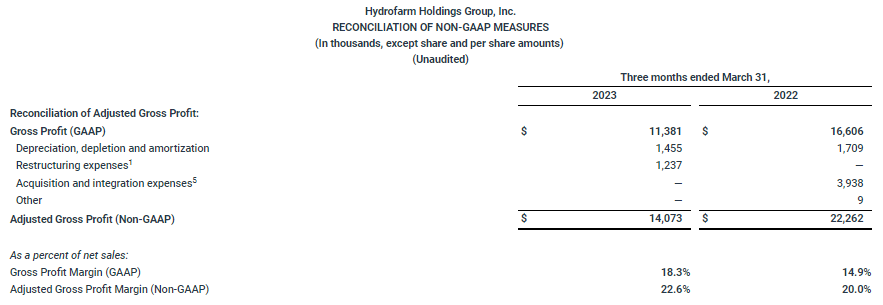
- Gross Profit decreased to $11.4 million compared to $16.6 million. Adjusted Gross Profit(1) was $14.1 million compared to $22.3 million.
- Gross Profit Margin increased to 18.3% of net sales compared to 14.9%. Adjusted Gross Profit Margin(1) increased to 22.6% of net sales compared to 20.0%.
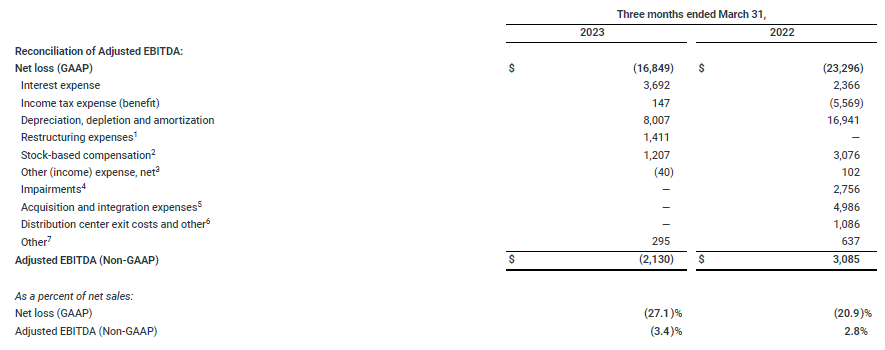
- Net loss was $(16.8) million, or $(0.37) per diluted share, compared to net loss of $(23.3) million, or $(0.52) per diluted share.
- Adjusted EBITDA(1) decreased to $(2.1) million compared to $3.1 million in the prior year period.
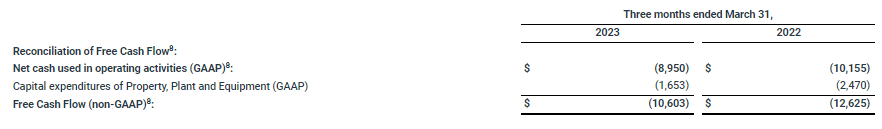
- Cash used in operating activities of $(9.0) million and negative Free Cash Flow(1) of $(10.6) million, a $2.0 million improvement compared to the first quarter of 2022.
Reaffirms Full Year 2023 Outlook:
- Net sales of approximately $290 million to $310 million, and now expects results to be toward the lower end of the range.
- Adjusted EBITDA(1) that is modestly positive.
- Positive Free Cash Flow(1).
(1) Adjusted Gross Profit, Adjusted Gross Profit Margin, Adjusted SG&A, Adjusted SG&A as a percent of net sales, Adjusted EBITDA, and Free Cash Flow are non-GAAP measures. For reconciliations of GAAP to non-GAAP measures see the “Reconciliation of Non-GAAP Measures” accompanying the release.
Bill Toler, Chairman and Chief Executive Officer of Hydrofarm, said, “I am proud of our team who has worked tirelessly to execute on our restructuring and related cost savings initiatives while navigating the challenging operating environment as the broader industry finds its way through supply/demand imbalances.”
We recently completed the consolidation of our Canadian nutrient manufacturing facility, the closure of our regional office in China as well as the relocation of our distribution center in Western Canada.
 Bill Toler, Chairman and Chief Executive Officer of Hydrofarm
We have made strides by reducing our overall costs in an effort to position ourselves to drive profitability in the near-term by improving brand sales mix, increasing productivity and reducing SG&A. We remain optimistic about our long-term business fundamentals and our ability to take advantage of growth opportunities ahead.
First Quarter 2023 Financial Results
Net sales in the first quarter of 2023 decreased to $62.2 million compared to $111.4 million in the first quarter of 2022, driven by a 42.5% decline in volume of products sold, a 1.1% decrease in price/mix of products sold, and a 0.6% decline from unfavorable foreign exchange rates. The decrease in volume of products sold was primarily related to oversupply in the cannabis industry. The reduction in price was mainly due to the sell-through of discounted lighting products. The decrease in foreign exchange related to strength in the U.S. Dollar relative to the Canadian Dollar.
Gross profit decreased to $11.4 million during the first quarter of 2023 compared to $16.6 million in the prior year period. The decrease was primarily related to the decrease in net sales. Gross profit margin percentage increased to 18.3% for the three months ended March 31, 2023, from 14.9% in the same period in 2022. Gross profit margin percentage was negatively impacted by restructuring charges of $1.2 million in the first quarter of 2023. Gross profit margin percentage was negatively impacted by acquisition expenses of $3.9 million and an increase in inventory allowances of $3.2 million in the first quarter of 2022. Adjusted Gross Profit(1) margin increased to 22.6% of net sales in the first quarter of 2023, compared to 20.0% of net sales in the prior year period. The improvement includes benefits from selling a higher proportion of proprietary brand products and from improved productivity.
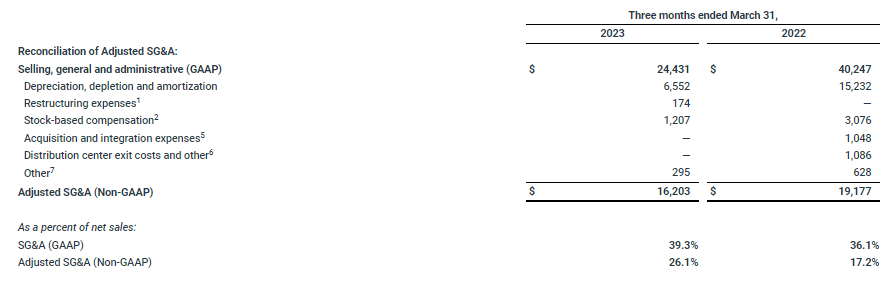
Selling, general and administrative (“SG&A”) expense was $24.4 million in the first quarter of 2023, compared to $40.2 million in the first quarter of 2022. The decrease was primarily related to an $8.7 million decline in amortization expenses and a $7.2 million decline in costs associated with compensation, distribution center relocations, acquisitions, and other professional fees. Adjusted SG&A(1) decreased to $16.2 million in the first quarter of 2023, compared to $19.2 million in the prior year period. The decrease primarily relates to a decline in compensation costs and other professional fees as a result of the restructuring plan and related cost saving initiatives.
Net loss was $(16.8) million, $(0.37) per diluted share, in the first quarter of 2023, compared to a net loss of $(23.3) million, or $(0.52) per diluted share, in the first quarter of 2022. The improvement was primarily due to significantly lower SG&A expenses, partially offset by lower net sales and gross profit in 2023, and current year tax expense compared to a tax benefit in the prior year.
Adjusted EBITDA(1) was $(2.1) million for the first quarter of 2023, compared to $3.1 million in the first quarter of 2022. The decrease was primarily related to lower sales, partially offset by higher adjusted gross profit margin and lower adjusted SG&A.
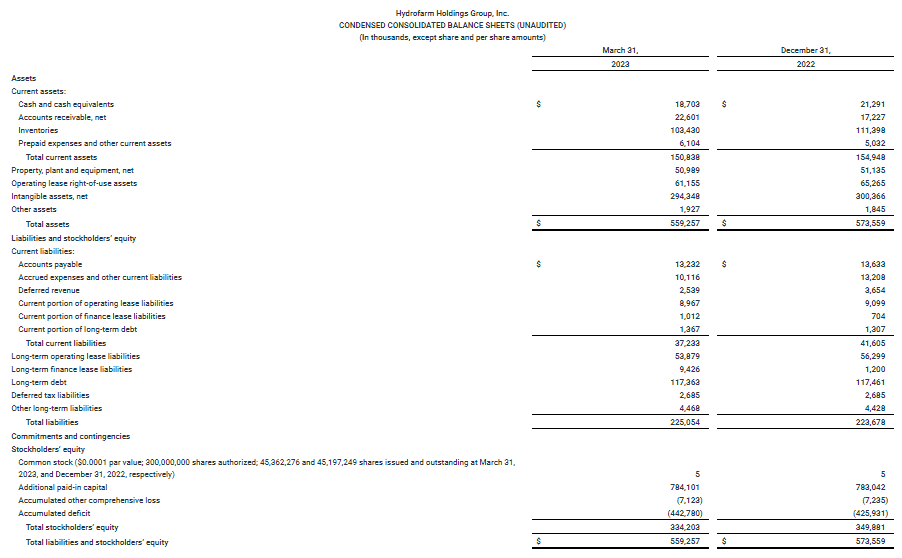
Balance Sheet, Liquidity and Cash Flow
As of March 31, 2023, the Company had $18.7 million in cash and $123.4 million in principal balance on its Term Loan outstanding. In addition, the Company had approximately $10.4 million in finance leases and $0.2 million in other debt outstanding. During the first quarter of 2023, the Company maintained a zero balance on its Revolving Credit Facility. The Company had approximately $39 million of available borrowing capacity on its Revolving Credit Facility, and was in compliance with debt covenants as of March 31, 2023. In addition, on March 31, 2023, the Company entered into a fifth amendment to its Revolving Credit Facility to extend the maturity date to June 30, 2026 and reduce the maximum commitment amount to $55 million which reduces fees on unused availability.
In the first quarter, cash used in operating activities was $(9.0) million and capital expenditures were $(1.7) million, yielding negative Free Cash Flow(1) of $(10.6) million, a $2.0 million improvement compared to 2022. The first quarter cash usage from operating activities was due primarily to seasonality and cash payments relating to the restructuring plan. The Company completed the sale-leaseback of real estate located in Eugene, Oregon and received approximately $8.6 million in gross proceeds, which was classified per GAAP as a financing activity and was not reflected in cash used in operating activities or Free Cash Flow(1).
Reaffirms Full Year 2023 Outlook
The Company is reaffirming its full year 2023 outlook:
- Net sales of approximately $290 million to $310 million, and the Company now expects results to be toward the low end of the range.
- Adjusted EBITDA(1) that is modestly positive for the full year, consistent with previous expectations.
- Free Cash Flow(1) that is positive for the full year, consistent with previous expectations.
The Company’s 2023 outlook also reaffirms the following assumptions, consistent with previous expectations:
- Improved year-over-year Adjusted Gross Profit(1) and Adjusted Gross Profit margin(1) resulting primarily from (i) cost savings associated with restructuring and related productivity initiatives and (ii) an expectation of minimal additional inventory and accounts receivable reserves or related charges.
- Capital expenditures of approximately $7 million to $9 million.
- Further reduction in inventory and net working capital helping to generate positive Free Cash Flow(1).
(1) Adjusted Gross Profit, Adjusted Gross Profit Margin, Adjusted SG&A, Adjusted SG&A as a percent of net sales, Adjusted EBITDA, and Free Cash Flow are non-GAAP measures. For reconciliations of GAAP to non-GAAP measures see the “Reconciliation of Non-GAAP Measures” accompanying the release.
Conference Call
The Company will host a conference call to discuss financial results for the first quarter 2023 today at 4:30 p.m. Eastern Time. Bill Toler, Chairman and Chief Executive Officer, and John Lindeman, Chief Financial Officer, will host the call.
The conference call can be accessed live over the phone by dialing 1-877-451-6152. The conference call will also be webcast live and archived on the corporate website at www.hydrofarm.com, under the “News & Events” section.
About Hydrofarm Holdings Group, Inc.
Hydrofarm is a leading independent manufacturer and distributor of branded hydroponics equipment and supplies for controlled environment agriculture, including grow lights, climate control solutions, growing media and nutrients, as well as a broad portfolio of innovative and proprietary branded products. For over 40 years, Hydrofarm has helped growers make growing easier and more productive. The Company’s mission is to empower growers, farmers and cultivators with products that enable greater quality, efficiency, consistency and speed in their grow projects.
Notes to GAAP to Non-GAAP reconciliations presented above (Adjusted Gross Profit, Adjusted SG&A, Adjusted EBITDA, and Free Cash Flow):
- For the three months ended March 31, 2023, restructuring expenses related primarily to the relocation and termination of certain facilities in Canada and the closure of the Company’s supply chain management office in China.
- Includes stock-based compensation and related employer payroll taxes on stock-based compensation for the periods presented.
- Other (income) expense, net related primarily to foreign currency exchange rate gains and losses and other non-operating income and expenses.
- For the three months ended March 31, 2022, the Company recorded an impairment primarily related to a charge associated with a note receivable that originated in 2019 in connection with a third party independent processor.
- For the three months ended March 31, 2022, this included charges related to acquisitions completed in 2021, including non-cash purchase accounting inventory adjustments, transaction services and legal fees, as well as the impact of changes in fair value of contingent consideration.
- For the three months ended March 31, 2022, this related to costs incurred to exit and relocate distribution centers in California and Pennsylvania including lease exit costs, transportation, and labor related costs.
- For the three months ended March 31, 2023, Other includes charges in conjunction with the Sale-Leaseback Transaction. For the three months ended March 31, 2022, Other included severance costs related to workforce reductions to optimize our cost structure.
- Gross proceeds of $8.6 million from the sale-leaseback of real estate located in Eugene, Oregon, was classified as a financing activity and is not reflected in cash used in operating activities or Free Cash Flow.
Non-GAAP Financial Measures
We report our financial results in accordance with generally accepted accounting principles in the U.S. (“GAAP”). Management believes that certain non-GAAP financial measures provide investors with additional useful information in evaluating our performance and that excluding certain items that may vary substantially in frequency and magnitude period-to-period from net loss provides useful supplemental measures that assist in evaluating our ability to generate earnings and to more readily compare these metrics between past and future periods. These non-GAAP financial measures may be different than similarly titled measures used by other companies.
To supplement our condensed consolidated financial statements which are prepared in accordance with GAAP, we use “Adjusted EBITDA”, “Adjusted Gross Profit”, “Adjusted SG&A”, and “Free Cash Flow” which are non-GAAP financial measures. We also present certain of these non-GAAP metrics as a percentage of net sales. Our non-GAAP financial measures should not be considered in isolation from, or as substitutes for, financial information prepared in accordance with GAAP. There are several limitations related to the use of our non-GAAP financial measures as compared to the closest comparable GAAP measures.
We define Adjusted EBITDA (non-GAAP) as net loss (GAAP) excluding interest expense, income taxes, depreciation, depletion and amortization, stock-based compensation including employer payroll taxes on stock-based compensation, restructuring charges which represent fundamental changes to our operations, and other non-cash, unusual and/or infrequent costs (i.e., impairments, acquisition and integration expenses, distribution center exit costs, and other income/expense, net), which we do not consider in our evaluation of ongoing operating performance.
We define Adjusted EBITDA (non-GAAP) as a percent of net sales as adjusted EBITDA (as defined above) divided by net sales realized in the respective period.
We define Adjusted Gross Profit (non-GAAP) as gross profit (GAAP) excluding depreciation, depletion, and amortization, restructuring charges, and other non-cash, unusual and/or infrequent costs (i.e., other expenses, and acquisition and integration expenses), which we do not consider in our evaluation of ongoing operating performance.
We define Adjusted Gross Profit Margin (non-GAAP) as a percent of net sales as Adjusted Gross Profit (as defined above) divided by net sales realized in the respective period.
We define Adjusted SG&A (non-GAAP) as SG&A (GAAP) excluding depreciation, depletion, and amortization, stock-based compensation including employer payroll taxes on stock-based compensation, restructuring charges, and other non-cash, unusual and/or infrequent costs (i.e., other expenses, acquisition and integration expenses, and distribution center exit costs), which we do not consider in our evaluation of ongoing operating performance.
We define Adjusted SG&A (non-GAAP) as a percent of net sales as Adjusted SG&A (as defined above) divided by net sales realized in the respective period.
We define Free Cash Flow (non-GAAP) as Net cash from (used in) operating activities less capital expenditures for property, plant and equipment. We believe this provides additional insight into the Company’s ability to generate cash and maintain liquidity. However, Free Cash Flow does not represent funds available for investment or other discretionary uses since it does not deduct cash used to service our debt or other cash flows from financing activities. The Company defines net debt as total debt principal outstanding less cash, cash equivalents and restricted cash.