![]()
Hydrofarm Holdings Group Announces Fourth Quarter and Full Year 2022 Results
SHOEMAKERSVILLE, Pa., March 09, 2023 (GLOBE NEWSWIRE) — Hydrofarm Holdings Group, Inc. (“Hydrofarm” or the “Company”) (Nasdaq: HYFM), a leading independent manufacturer and distributor of branded hydroponics equipment and supplies for controlled environment agriculture (“CEA”), today announced financial results for its fourth quarter and full year ended December 31, 2022.
Fourth Quarter 2022 Highlights vs. Prior Year Period:
- Net sales decreased to $61.5 million compared to $110.4 million.
- Gross Loss was $(0.5) million compared to gross profit of $18.7 million.
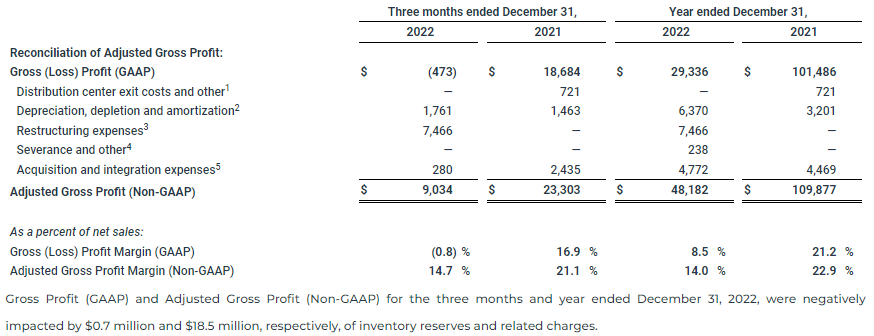
- Adjusted Gross Profit(1)(2) was $9.0 million compared to $23.3 million; Adjusted Gross Profit(1)(2) in the fourth quarter 2022 was unfavorably impacted by $0.7 million in inventory reserves and related charges.
- Net loss was $(35.3) million compared to net loss of $(11.0) million.
- Adjusted EBITDA(1)(2) decreased to $(8.4) million compared to $4.9 million in the prior year period; Adjusted EBITDA(1)(2) in the fourth quarter of 2022 was unfavorably impacted by $2.5 million of inventory and accounts receivable reserves and related charges.
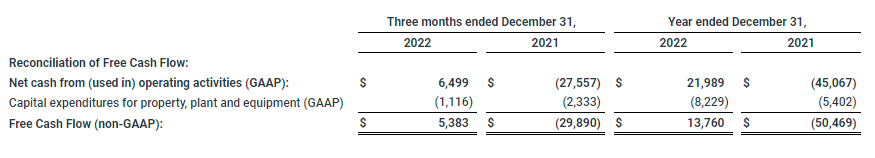
- Generated net cash from operating activities of $6.5 million and positive Free Cash Flow(1) of $5.4 million.
- Initiated a restructuring to further right-size the Company and enable cost-savings in future periods.
Fiscal Year 2022 Highlights vs. Prior Year:
- Net sales decreased to $344.5 million compared to $479.4 million.
- Gross profit decreased to $29.3 million compared to $101.5 million.
- Adjusted Gross Profit(1)(2) was $48.2 million compared to $109.9 million; Adjusted Gross Profit(1)(2) was unfavorably impacted by $18.5 million in inventory reserves and related charges.
- Net loss decreased to $(285.4) million compared to net income of $13.4 million.
- Adjusted EBITDA(1)(2) decreased to $(21.2) million compared to $47.1 million; Adjusted EBITDA(1)(2) was unfavorably impacted by $21.4 million of inventory and accounts receivable reserves and related charges.
Full Year 2023 Outlook:
- Net sales of approximately $290 million to $310 million.
- Adjusted EBITDA(1) that is modestly positive.
- Positive Free Cash Flow(1).
(1) Adjusted Gross (Loss) Profit, Adjusted Gross Profit Margin, Adjusted Net (Loss) Income, Adjusted EPS, Adjusted SG&A, Adjusted SG&A as a percent of net sales, Adjusted EBITDA, and Free Cash Flow are non-GAAP measures. See the “Reconciliation of Non-GAAP Measures” accompanying the release.
(2) The $2.5 million of inventory and accounts receivable reserves and related charges negatively impacted Net Loss, Adjusted Net (Loss) Income, EPS, Adjusted EPS, and Adjusted EBITDA. Of the $2.5 million, $0.7 million negatively impacted Gross Profit and Adjusted Gross Profit.
Bill Toler, Chairman and Chief Executive Officer of Hydrofarm, said, “While the current operating environment remains challenging, I am encouraged that we finished 2022 with our net sales coming in at the upper end of our previously provided outlook and that we generated positive Free Cash Flow¹ for the third quarter in a row.”
We have experienced sales stabilization over the last several months and are seeing some positive indicators that the industry is moving closer to a rebound. I am pleased with the many actions behind the restructuring initiative and related actions that our team has launched to right-size our business and become a leaner, more profitable company.
 Bill Toler, Chairman and Chief Executive Officer of Hydrofarm
We remain confident in the long-term strength of our business, as our disciplined approach to working capital and restructuring actions initiated in 2022 have put us in a healthy position heading into 2023 and beyond.
Fourth Quarter 2022 Financial Results
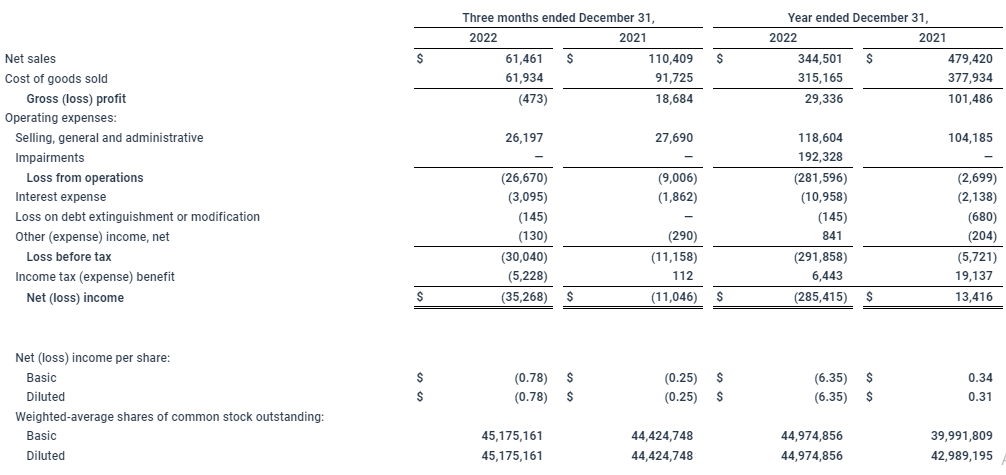
Net sales in the fourth quarter of 2022 decreased to $61.5 million compared to $110.4 million in the fourth quarter of 2021, driven by a 42.9% decrease in volume of products sold resulting primarily from the industry recession, a 0.9% decline in price and mix of products sold resulting primarily from the sell-through of discounted lighting products, and a 0.5% decline from unfavorable foreign exchange rates.
As noted earlier, the Company initiated a restructuring in the fourth quarter of 2022 to streamline operations, reduce costs and improve efficiencies. Major initiatives include narrowing the Company’s product and brand portfolio and relocating and consolidating certain manufacturing and distribution centers, including the pending closure of two Company locations, and contract terminations and amendments. The restructuring resulted in charges of $7.7 million in the fourth quarter of which approximately $6.1 million are non-cash. Hydrofarm expects the restructuring and related actions to result in cost savings of approximately $7.0 million annually.
Gross loss, which was impacted significantly by the aforementioned restructuring charges, was $(0.5) million, or (0.8)% of sales, during the fourth quarter of 2022 compared to $18.7 million of gross profit, or 16.9% of sales in the fourth quarter of 2021. Adjusted Gross Profit(1)(2) was $9.0 million or 14.7% of net sales, compared to $23.3 million or 21.1% in the fourth quarter of 2021. Gross profit and Adjusted gross profit(1)(2) were negatively impacted by $0.7 million in inventory reserves and related charges, as well as higher freight and labor costs as a percentage of net sales.
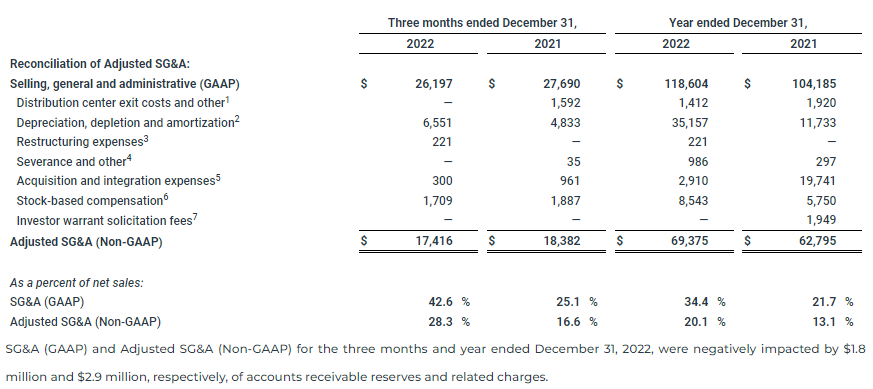
Selling, general and administrative (“SG&A”) expense was $26.2 million in the fourth quarter of 2022, or 42.6% of net sales, compared to $27.7 million in the fourth quarter of 2021, or 25.1% of net sales. Adjusted SG&A(1)(2) decreased to $17.4 million or 28.3% of net sales in the fourth quarter of 2022, compared to $18.4 million or 16.6% of net sales in the prior year period. SG&A and Adjusted SG&A(1)(2) were negatively impacted by $1.8 million in accounts receivable reserves and related charges in the fourth quarter of 2022. The decrease in Adjusted SG&A(1)(2) primarily relates to lower employee compensation costs, professional and outside services costs, and facilities costs, partially offset by an increase in insurance expense.
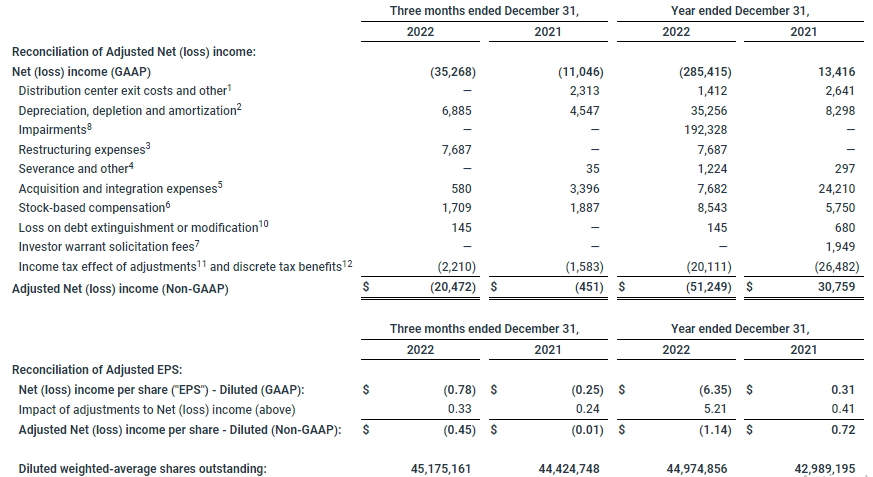
Net loss was $(35.3) million, $(0.78) per diluted share, or (57.4)% of net sales, in the fourth quarter of 2022, compared to a net loss of $(11.0) million, or $(0.25) per diluted share, or (10.0)% of net sales, in the fourth quarter of 2021. Net loss in the fourth quarter of 2022 was due to a significant decline in net sales compared to the prior year, as well as $7.7 million of restructuring costs and an additional $2.5 million of inventory and accounts receivable reserves and related charges. Adjusted Net Loss(1)(2) was $(20.5) million, or $(0.45) per diluted share, in the fourth quarter of 2022, compared to Adjusted Net Loss(1)(2) of $(0.5) million, or $(0.01) per diluted share, in the fourth quarter of 2021.
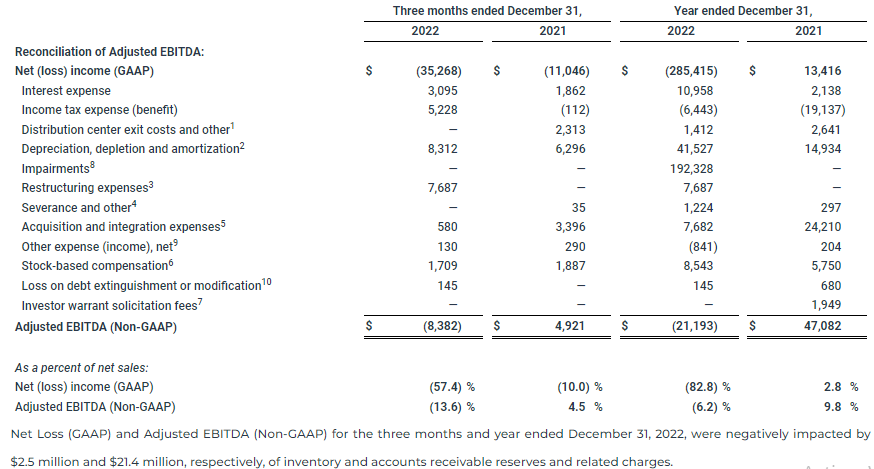
Adjusted EBITDA(1)(2) was $(8.4) million, or (13.6)% of net sales, in the fourth quarter of 2022, compared to $4.9 million, or 4.5% of net sales, in the fourth quarter of 2021. The decrease in Adjusted EBITDA(1)(2) was primarily related to significantly lower net sales, lower adjusted gross profit margin, and $2.5 million of inventory and accounts receivable reserves and related charges.
Balance Sheet and Liquidity
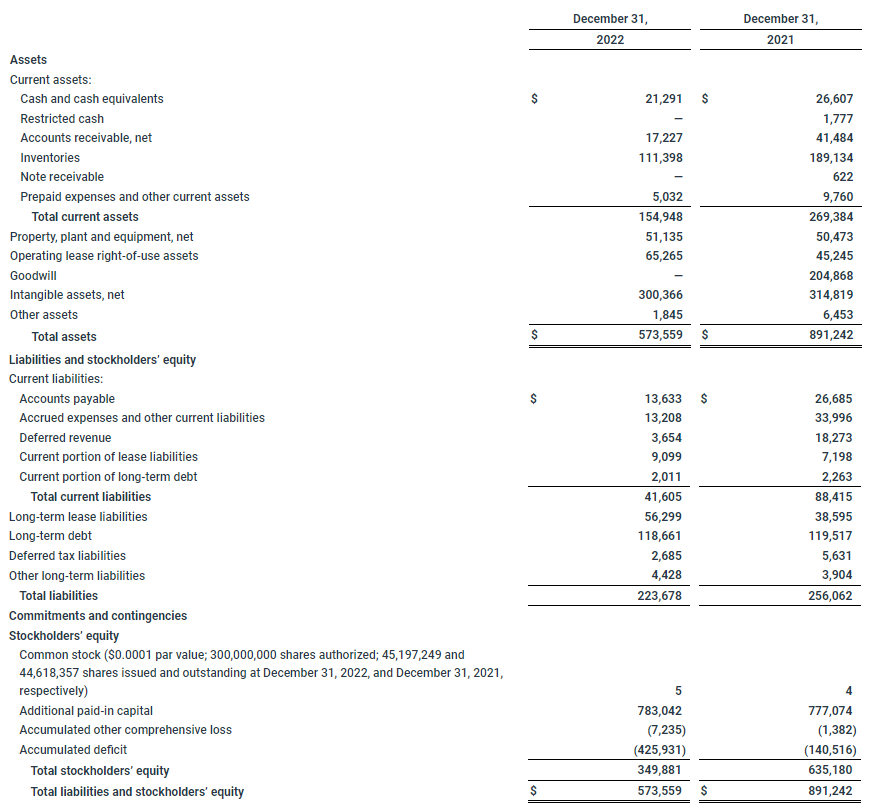
As of December 31, 2022, the Company had $21.3 million in cash and an aggregate principal amount of debt outstanding of $125.8 million which consisted of approximately $123.8 million in principal balance on its Term Loan and approximately $2.1 million in finance leases and other debt. In the fourth quarter, the Company generated net cash from operations, positive free cash flow and maintained a zero balance on its revolving credit facility. For the full twelve month period ended December 31, 2022, the Company generated net cash from operating activities of $22.0 million and positive Free Cash Flow(1) of $13.8 million, largely from favorable working capital management. The Company had approximately $40 million of available borrowing capacity on its revolving line of credit and was in compliance with all debt covenants as of December 31, 2022.
On January 10, 2023, the Company completed the sale and leaseback of real estate located in Eugene, Oregon (the “Eugene Property”) and received approximately $8.6 million in gross proceeds (the “Sale-Leaseback Transaction”). The Eugene Property serves as the manufacturing and processing site for certain of the Company’s grow media and nutrient brands. The Company intends to reinvest the net proceeds from the Sale-Leaseback Transaction into certain permitted investments, such as capital expenditures, which are expected to primarily support growth and productivity programs in 2023.
Full Year 2023 Outlook
The Company is providing the following outlook for the full fiscal year 2023:
- Net sales of approximately $290 million to $310 million, which assumes that average daily sales levels continue across the first quarter of 2023 at levels similar to those achieved in the fourth quarter of 2022 and a seasonal increase in average daily sales levels begins in early second quarter of 2023.
- Adjusted EBITDA(1) that is modestly positive for the full year.
- Free Cash Flow(1) that is positive for the full year.
Hydrofarm’s 2023 outlook is predicated on several assumptions, including:
- Improved Adjusted Gross Profit(1) and Adjusted Gross Profit margin(1) resulting primarily from (i) cost savings associated with restructuring and related productivity initiatives and (ii) an expectation of minimal additional inventory and accounts receivable reserves or related charges.
- Capital expenditures of approximately $7 million to $9 million.
- Further reduction in inventory and net working capital helping to generate positive Free Cash Flow(1).
(1) Adjusted Gross (Loss) Profit, Adjusted Gross Profit Margin, Adjusted Net (Loss) Income, Adjusted EPS, Adjusted SG&A, Adjusted SG&A as a percent of net sales, Adjusted EBITDA, and Free Cash Flow are non-GAAP measures. See the “Reconciliation of Non-GAAP Measures” accompanying the release.
Conference Call
The Company will host a conference call to discuss financial results for the fourth quarter and full year 2022 today at 4:30 p.m. Eastern Time. Bill Toler, Chairman and Chief Executive Officer, and John Lindeman, Chief Financial Officer, will host the call.
The conference call can be accessed live over the phone by dialing 1-888-886-7786. The conference call will also be webcast live and archived on the corporate website at www.hydrofarm.com, under the “News & Events” section.
About Hydrofarm Holdings Group, Inc.
Hydrofarm is a leading independent manufacturer and distributor of branded hydroponics equipment and supplies for controlled environment agriculture, including grow lights, climate control solutions, growing media and nutrients, as well as a broad portfolio of innovative and proprietary branded products. For over 40 years, Hydrofarm has helped growers make growing easier and more productive. The Company’s mission is to empower growers, farmers and cultivators with products that enable greater quality, efficiency, consistency and speed in their grow projects.
Hydrofarm Holdings Group, Inc.
CONDENSED CONSOLIDATED STATEMENTS OF OPERATIONS (UNAUDITED)
(In thousands, except share and per share amounts)
Hydrofarm Holdings Group, Inc.
CONDENSED CONSOLIDATED BALANCE SHEETS (UNAUDITED)
(In thousands, except share and per share amounts)
Hydrofarm Holdings Group, Inc.
RECONCILIATION OF NON-GAAP MEASURES
(In thousands, except share and per share amounts)
(Unaudited)
Notes to GAAP to Non-GAAP reconciliations presented above (Adjusted Gross Profit, Adjusted SG&A, Adjusted EBITDA, Adjusted Net (loss) income, Adjusted Net (loss) income per share – Diluted, and Free Cash Flow):
- For the 2022 and 2021 periods presented, this relates to costs incurred to exit and relocate distribution centers in California and Pennsylvania including lease exit costs, transportation, and labor related costs.
- Depreciation, depletion and amortization increased significantly over the prior year due primarily to several acquisition related purchase-accounting adjustments impacting the year ended December 31, 2022. For purposes of computing adjusted net (loss) income for the periods presented, the Company is including only the amortization and depreciation expense amounts relating to 2021 acquisitions for comparability to the prior year.
- During the year ended December 31, 2022, the Company recorded pre-tax charges of $6.8 million relating to the inventory markdowns of products and brands being removed from our portfolio, which is primarily non-cash, and $0.9 million relating primarily to the relocation and termination of certain facilities in Canada, which are primarily cash charges.
- Severance and other primarily consists of severance costs incurred during the year ended December 31, 2022, related to workforce reductions to optimize our cost structure. Severance and other primarily consists of costs related to an aborted financing during the year ended December 31, 2021.
- For the year ended December 31, 2022, acquisition and integration expenses include non-cash purchase accounting inventory adjustments for House and Garden, Aurora, Greenstar and Innovative Growers Equipment of $4.8 million, and acquisition and integration consulting, transaction services and legal fees incurred for the completed Heavy 16, House and Garden, Aurora, Greenstar, and Innovative Growers Equipment acquisitions and certain potential acquisitions of $4.5 million, partially offset by the change in fair value of contingent consideration for Aurora of ($1.6 million). For the prior year period, acquisition and integration expenses primarily include investment banking, consulting, transaction services and legal fees incurred for the completed Heavy 16, House & Garden, Aurora, Greenstar, and Innovative Growers Equipment acquisitions and certain potential acquisitions, including non-cash purchase accounting inventory adjustments of $4.5 million, partially offset by the change in fair value of contingent consideration for Aurora of ($2.5 million) for the year ended December 31, 2021.
- Includes stock-based compensation expense and related employer payroll taxes on stock-based compensation for the periods presented.
- Reflects the elimination of investor warrant solicitation fees.
- The Company completed its goodwill impairment testing and recorded an impairment charge of $189.6 million during the year ended December 31, 2022, due to market softness in demand in the U.S. and Canada. Additionally, during the year ended December 31, 2022, the Company recorded an impairment primarily related to a $2.6 million charge associated with a note receivable that originated in 2019 associated with a third party independent processor serving the CBD market.
- Other (income) expense, net relates primarily to foreign currency exchange rate gains and losses and other non-operating income and expenses.
- For the year ended December 31, 2022, loss on debt extinguishment or modification resulted primarily from the write-off of unamortized deferred financing costs associated with the modification of the JPMorgan Revolving Loan Facility entered into during the fourth quarter of 2022, which reduced our borrowing capacity from $100 million to $75 million. For the year ended December 31, 2021, loss on debt extinguishment or modification resulted primarily from the write-off of unamortized deferred financing costs associated with the termination of the Encina Credit Facility.
- Reflects the income tax effect related to adjustments to net (loss) income at the normalized tax rate of 13%, which reflects an estimated tax rate based on the nature of these adjustments. The impairments recorded during the year ended December 31, 2022 are excluded from these income tax effects as income tax benefits are presented discretely.
- For the year ended December 31, 2022, the Company recorded discrete income tax benefits of approximately $12.1 million related to measurement period adjustments associated with 2021 acquisitions and certain tax benefits related to goodwill impairment.
Non-GAAP Financial Measures
We report our financial results in accordance with generally accepted accounting principles in the U.S. (“GAAP”). Management believes that certain non-GAAP financial measures provide investors with additional useful information in evaluating our performance and that excluding certain items that may vary substantially in frequency and magnitude period-to-period from net (loss) income provides useful supplemental measures that assist in evaluating our ability to generate earnings and to more readily compare these metrics between past and future periods. These non-GAAP financial measures may be different than similarly titled measures used by other companies.
To supplement our condensed consolidated financial statements which are prepared in accordance with GAAP, we use “Adjusted EBITDA”, “Adjusted Gross Profit”, “Adjusted SG&A”, “Adjusted Net (loss) income”, “Adjusted Net (loss) income per diluted share” or “Adjusted EPS”, and “Free Cash Flow” which are non-GAAP financial measures. We also present certain of these non-GAAP metrics as a percentage of net sales. Our non-GAAP financial measures should not be considered in isolation from, or as substitutes for, financial information prepared in accordance with GAAP. There are several limitations related to the use of our non-GAAP financial measures as compared to the closest comparable GAAP measures.
We define Adjusted EBITDA (non-GAAP) as net (loss) income (GAAP) excluding interest expense, income taxes, depreciation, depletion and amortization, stock-based compensation including employer payroll taxes on stock-based compensation and other non-cash, unusual and/or infrequent costs (i.e., restructuring, impairments, severance and other expenses, acquisition and integration expenses, distribution center exit costs, loss on debt extinguishment or modification, investor warrant solicitation fees, and other income/expense, net), which we do not consider in our evaluation of ongoing operating performance.
We define Adjusted EBITDA (non-GAAP) as a percent of net sales as adjusted EBITDA (as defined above) divided by net sales realized in the respective period.
We define Adjusted Gross Profit (non-GAAP) as gross profit (GAAP) excluding depreciation, depletion, and amortization, and other non-cash, unusual and/or infrequent costs (i.e., severance and other expenses, and acquisition and integration expenses), which we do not consider in our evaluation of ongoing operating performance.
We define Adjusted Gross Profit Margin (non-GAAP) as a percent of net sales as adjusted Gross Profit Margin (as defined above) divided by net sales realized in the respective period.
We define Adjusted SG&A (non-GAAP) as SG&A (GAAP) excluding depreciation, depletion, and amortization, and other non-cash, unusual and/or infrequent costs (i.e., impairment, severance and other expenses, acquisition and integration expenses, stock-based compensation including employer payroll taxes on stock-based compensation, investor warrant solicitation fees, and distribution center exit costs), which we do not consider in our evaluation of ongoing operating performance.
We define Adjusted SG&A (non-GAAP) as a percent of net sales as Adjusted SG&A (as defined above) divided by net sales realized in the respective period.
We define Adjusted Net (loss) income (non-GAAP) as net (loss) income excluding adjustments to stock-based compensation and employer payroll taxes on stock-based compensation, and certain other non-cash, unusual and/or infrequent costs including those relating to our five acquisitions in 2021 (i.e., Depreciation, depletion and amortization related to acquisitions, impairment, severance and other expenses, acquisition and integration expenses, loss on debt extinguishment or modification, investor warrant solicitation fees and distribution center exit costs), which we do not consider in our evaluation of ongoing operating performance, and the income tax impact resulting from the above adjustments to net (loss) income.
We define Adjusted Net (loss) income per share – Diluted (non-GAAP) or Adjusted EPS (non-GAAP) as adjusted net (loss) income as defined above divided by the weighted average diluted shares outstanding.
We define Free Cash Flow (non-GAAP) as Net cash from (used in) operating activities less capital expenditures for property, plant and equipment. We believe this provides additional insight into the Company’s ability to generate cash and maintain liquidity. However, Free Cash Flow does not represent funds available for investment or other discretionary uses since it does not deduct cash used to service our debt or other cash flows from financing activities. For the three months ended September 30, 2022, cash flow from operating activities was $8.2 million, less capital expenditures for property, plant, and equipment of approximately $2.6 million, yielded positive Free Cash Flow of $5.6 million. For the three months ended June 30, 2022, cash flow from operating activities was $17.4 million, less capital expenditures for property, plant, and equipment of approximately $2.0 million, yielded positive Free Cash Flow of $15.4 million.
The Company defines net debt as total debt principal outstanding less cash, cash equivalents and restricted cash.