A Detailed Look at Cannabis Sales in California, Oregon, Arizona, Colorado, Nevada and Maryland
We are pleased to share with our readers overviews on five important Western cannabis markets as well as Maryland compiled by BDS Analytics for the month of January. BDS Analytics offers a full understanding of the evolving cannabis market though several offerings, including its GreenEdge Retail Sales Tracking, Consumer Insights, Industry Intelligence and CBD Market Monitor divisions. For those not familiar with the Colorado-based company, which was founded in 2015 and is run by co-founders CEO Roy Bingham and President Liz Stahura, we have been covering their progress since almost day 1.
During January, the fifth month after the onset of the vaping crisis, sales across the six markets totaled $612.2 million, up 0.8% from December. Overall sales growth from a year ago among the five Western markets ranged from 8% in California to as high as 40% in Arizona. Concentrates, which represented 24-34% of sales by market, have improved from recent months but remain below the 26-38% in August. Growth in concentrates from a month ago ranged from -3% in California and Colorado to +5% in Arizona and Nevada, while flower sales ranged from -3% to +3%. The big story of the month was the decline in pre-rolls sequentially, with Arizona declining 10%, California falling 5%, Colorado dropping 7%, and Nevada and Oregon declining 1%. Pre-rolls had benefited from the decline in vape pens in late 2019.
Here is a closer look at each market, as detailed by BDS Analytics:
Arizona
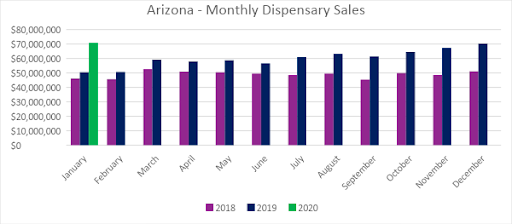
This past January, sales within medical dispensaries in Arizona totaled $70.8 million, a one percent increase from the trailing month. Compared to the previous January, sales in Arizona increased by 40 percent.
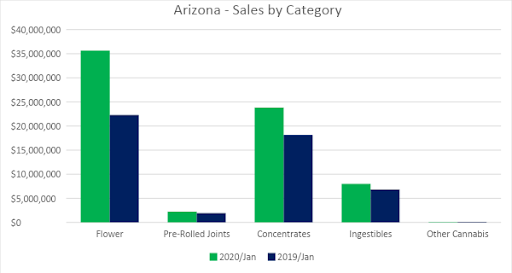
Flower sales made up 50 percent of overall revenue for the month, totaling $35.6 million in sales. Pre-rolled joints, which are tracked as a separate category and remain a small portion of Arizona’s medical-only market, made up three percent of overall revenues with $2.2 million in sales.
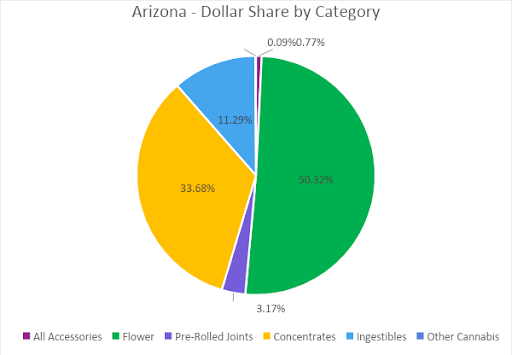
Concentrates sales made up 34 percent of overall revenues, totaling $23.9 million in January. Vape products generated $15.6 million in sales, accounting for more than 65 percent of the Arizona Concentrates market and 22 percent of sales across all categories.
The Ingestibles category made up over 11 percent of overall sales in January, totaling $8 million in revenue. Sublinguals sales made up 10 percent of revenue for the overall Ingestibles category, while Edibles made up the remaining 90 percent with $7.2 million in sales for the month.
California
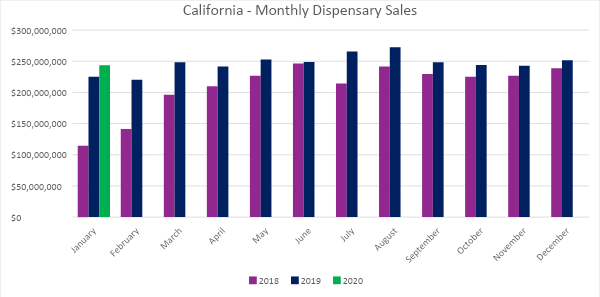
In the first month of 2020, legal cannabis sales reached $243.7 million. Compared to the trailing month, sales in the California market decreased by three percent. Compared to the previous January, monthly total sales grew more than eight percent.
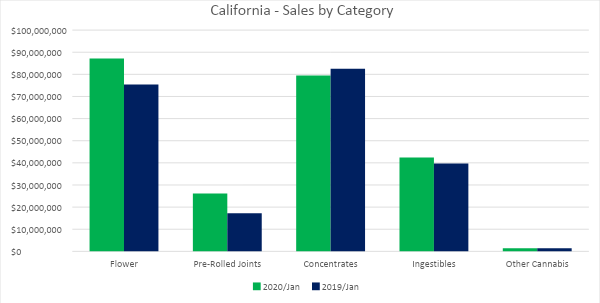
The Flower category generated $87.2 million in January sales, making up 36 percent of overall revenues for the month. Compared to December 2019, Flower sales declined by one percent. Compared to the previous January, category sales grew by 16 percent.
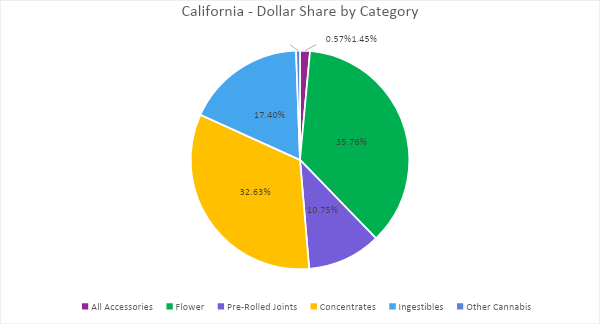
Concentrates were the second-largest category by sales in January, with revenues totaling $79.5 million. Compared to the trailing month, sales in the category declined by three percent; compared to the same time last year, sales declined by four percent. Vape continues to dominate the Concentrates category, reaching $63.7 million in sales for January. Vape sales generated 80 percent of category revenue and over 26 percent of total revenues for the month.
In January 2020, Ingestibles generated $42.4 million, representing a five percent decline from December. Compared to the previous January, sales of Ingestibles grew by nearly seven percent. Edibles sales made up 82 percent of category sales and 14 percent of overall revenues, reaching $34.6 million in sales. Sublinguals generated $7.7 million in January, accounting for the remaining 18 percent of Ingestibles revenue.
Colorado
Sales within Colorado’s adult-use and medical dispensaries reached $140 million in January 2020, a four percent decline from December 2019. Compared to the previous January, overall sales increased by 11 percent. Adult-use retailers enjoyed 12 percent sales growth, while medical dispensary sales increased by nearly six percent.

In January, Flower sales generated 43 percent of all revenues, totaling $60.4 million. Sales increased by 17 percent from January 2019. Pre-rolled joints, which are tracked separately from Flower, generated $9.2 million in sales for January, representing 31 percent growth from 2019.

Concentrate sales in January grew by two percent from 2019. With $44.3 million in sales, the category made up 32 percent of total revenues for the month. Vape sales were $21.7 million in January, a four percent increase from the year prior.
In January 2020, Ingestibles generated $22.4 million in sales, a nine percent decline from the trailing month but a 10 percent increase from the previous January.

Maryland
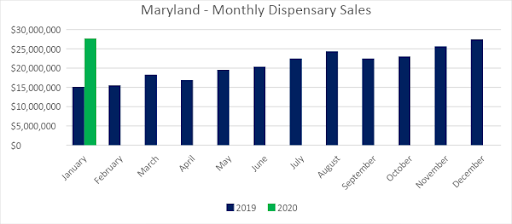
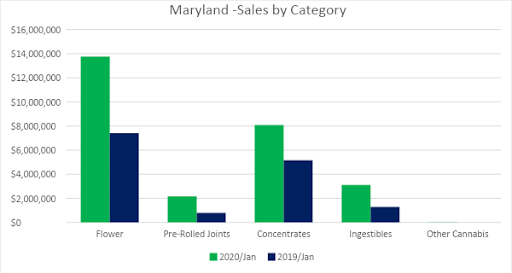
This past January, Maryland medical dispensary sales totaled $27.7 million, less than one percent growth from the trailing month. Compared to January 2019, monthly sales in Maryland increased by an impressive 83 percent.
The Flower category generated 50 percent of total revenue for the month, reaching $13.8 million in sales. Pre-rolled joints, which are tracked as a separate category, contributed another eight percent of overall revenues with $2.2 million in sales during the first month of the new decade.
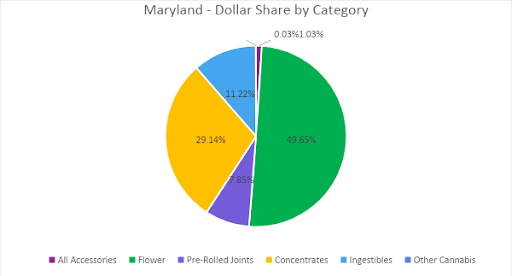
Concentrates, the second-largest category, generated 29 percent of revenues with sales surpassing $8 million in January. Vape products alone contributed more than $5.5 million in sales, representing 68 percent of the Maryland Concentrates market and 20 percent of sales across all categories.
The Ingestibles category contributed over 11 percent of sales in January, reaching $3.1 million in revenue for the month. Within the Ingestibles category, Edibles generated 86 percent of total Ingestibles revenue with $2.7 million in category sales. Sublinguals made up the remaining 14 percent in sales.
Nevada
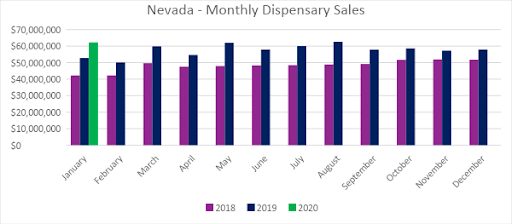
In January, Nevada dispensaries generated $62.3 million in sales. Compared to the previous January, sales grew by 18 percent. Compared to the trailing month, sales increased by three percent.
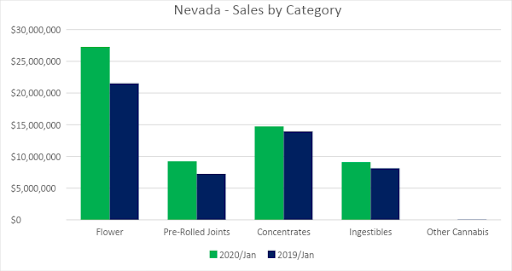
The Flower category made up 44 percent of sales in January, reaching a total of $27.3 million for the month and representing four percent growth from December. Pre-rolled joints, a category tracked separately from Flower, generated 15 percent of overall sales with $9.2 million in revenues.
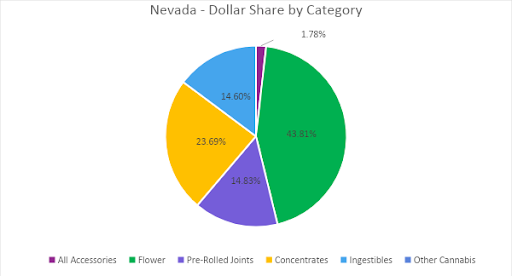
January Concentrate sales totaled at $14.8 million, accounting for 24 percent of overall revenues for the month. Compared to the previous January and trailing month, Concentrate sales increased by six percent and five percent, respectively.
Sales in the Ingestibles category generated 15 percent of total revenues in January 2020 with $9 million in sales. Compared to December, sales in the Ingestibles category increased by two percent; compared to January 2019, sales increased by 12 percent.
Oregon
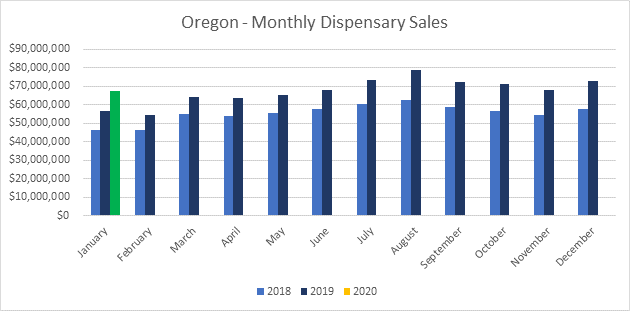
Sales within Oregon’s medical and adult-use dispensaries reached a combined $67.6 million in January 2020, remaining about the same as December 2019. Compared to the previous January, sales increased by nearly 19 percent.
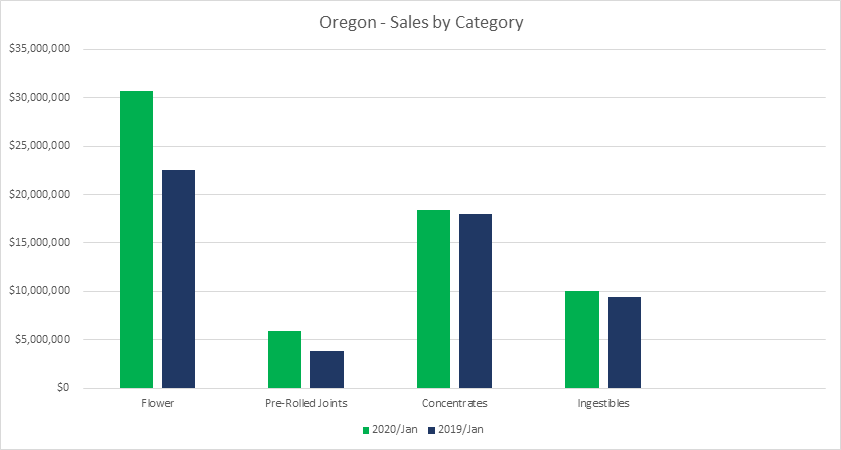
In January, Flower sales contributed almost 46 percent of total revenues, generating $30.7 million in sales. Flower sales grew by three percent from the trailing month and more than 36 percent from the prior January. Pre-rolled joints, which are tracked separately from Flower, generated $5.9 million in sales for January, representing 53 percent growth from 2019.
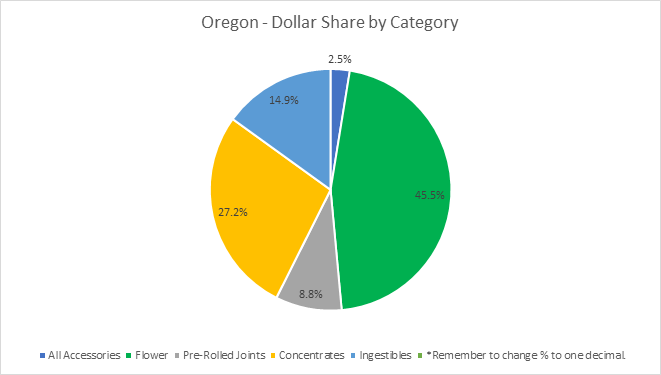
January Concentrate sales grew by two percent from 2019 and three percent from the trailing month. With $18.4 million in sales, the category contributed 27 percent of sales towards overall revenues for the month. Vape sales were $10.4 million in January, a 15 percent decline from the year prior and one percent increase from December 2019.
In January 2020, Ingestibles generated $10 million in sales, an eight percent decline from the trailing month and a seven percent increase from the previous January. The Edibles category made up 80 percent of overall Ingestible sales and 12 percent of total revenues for the month. Sublinguals contributed the remaining 20 percent, decreasing eight percent from the previous year as well as from the trailing month. Sublingual sales totaled $2 million in January, while Edibles reached more than $8 million.
For readers looking for a deeper look at cannabis markets across these five states and more, including segmentation by additional product categories, brand and item detail, longer history, and segmentation by product attributes, learn how the BDS Analytics GreenEdge Platform can provide you with unlimited access to the most accurate and actionable data and analysis.