![]() Visit the OrganiGram Investor Dashboard and stay up to date with data-driven, fact based due diligence for active traders and investors.
Visit the OrganiGram Investor Dashboard and stay up to date with data-driven, fact based due diligence for active traders and investors.

Organigram Reports Fourth Quarter and 2019 Fiscal Year Results
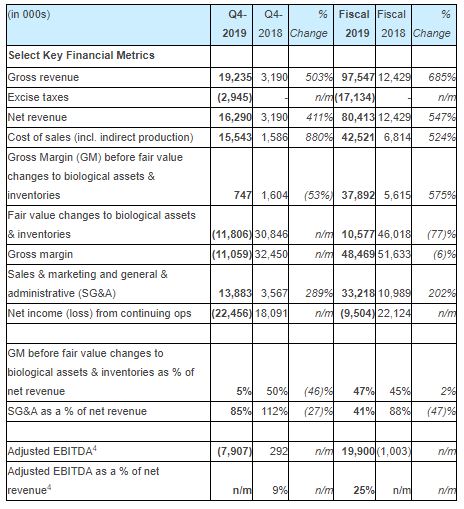
- 2019 net revenue grew 547% to $80.4 million from $12.4 million in 2018
- 2019 gross margin before fair value changes to biological assets and inventory grew 575% to $37.9 million or 47% of net revenue from $5.6 million or 45% of net revenue in 2018
- 2019 net loss from continuing operations of $9.5 million compared to net income from continuing operations of $22.1 million in 2018 largely due to non-cash fair value changes to biological assets and inventories
- 2019 adjusted EBITDA¹ of $19.9 million or 25% of net revenue compared to negative $1.0 million in 2018
- Sales in all 10 provinces – estimated YTD market share nationally of approximately 10% in the Canadian adult-use recreational cannabis market²
- Expect improved Q1 fiscal 2020 outlook from Q4 2019 with higher net revenue and adjusted gross margin and lower SG&A³ as a percentage of net revenue
- Phase 4C, the final phase of Moncton Campus facility expansion with respect to cultivation estimated at 70% complete; completion of 4C has been paused until more clarity on retail expansion in Canada
MONCTON, New Brunswick, November 25, 2019–(BUSINESS WIRE)–Organigram Holdings Inc. (NASDAQ: OGI) (TSX: OGI), the parent company of Organigram Inc. (the “Company” or “Organigram”), a leading licensed producer of cannabis, is pleased to announce its results for the fourth quarter and fiscal year ended August 31, 2019 (“Q4” or “Q4 2019”).’
“Our 2019 results reflected a successful year for Organigram. Not only did we report strong top-line growth and establish an enviable national market share position in Canada, we generated positive adjusted EBITDA – one of the key measures we use to evaluate our performance,” said Greg Engel, Chief Executive Officer. “In 2019, we increased staffing and capacity to meet forecasted demand and maintain inventory in the market. Industry structural issues have challenged supply and demand dynamics in the short-term but we believe the growth opportunity in the Canadian cannabis market remains intact.”
As we were one of the first success stories to supply the market in the early days of legalization, we have had visibility for some time now on ultimate sell through to consumers and have adapted our production mix and product strategy to align with our understanding of emerging consumer preferences. We have great conviction in our strategy and ability to onboard the new retail store openings and to launch a portfolio of edible and derivative products appealing to adult consumers.
 Greg Engel, Chief Executive Officer
With our state-of-the-art indoor facility and leading cultivation practices, strong brand equity, in-house expertise and strategic partnerships and a focus on cost management, we are well-positioned for the long term.
Key Financial Results for the Fourth Quarter and Fiscal 2019
- Net Revenue:
- In 2019 grew 547% to $80.4 million from $12.4 million in 2018
- In Q4 2019 grew 411% from $3.2 million in Q4 2018
- Growth attributable to the legalization of adult-use recreational cannabis in Canada. Year to date, the Company estimates it has approximately 10% national market share based on its analysis of available data including, but not limited to, market share data from select provinces and various public data.
- Gross Margin before fair value changes to biological assets and inventories:
- In 2019 grew 575% to $37.9 million from $5.6 million in 2018 primarily due to legalization of adult-use cannabis sales
- In Q4 2019, $0.7 million compared to Q4 2018 gross margin before fair value changes to biological assets and inventories of $1.6 million largely due to higher cost of sales and indirect production costs
- Gross Margin:
- In 2019 $48.5 million compared to $51.6 million in 2018 largely due to non-cash fair value changes to biological assets and inventories
- Q4 2019 gross margin of negative $11.1 million compared to Q4 2018 gross margin of $32.5 million, largely due to non-cash fair value changes to biological assets and inventories
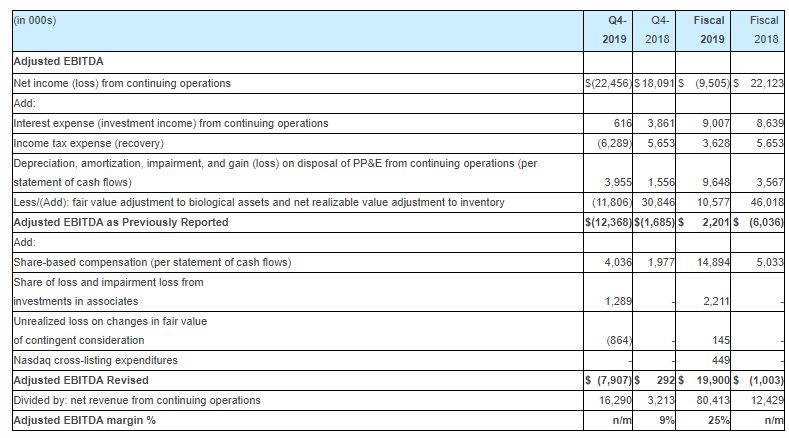
- Adjusted EBITDA⁵:
- In 2019 $19.9 million or 25% of net revenue compared to negative adjusted EBITDA of $1.0 million in 2018
- Q4 2019 negative adjusted EBITDA of $7.9 million compared to Q4 2018 adjusted EBITDA of $0.3 million
- Q4 negative adjusted EBITDA was impacted by lower adjusted gross margin (described above) and higher SG&A compared to Q4 2018 as the Company increased staffing and sales and marketing efforts in response to the first year of legalized adult-use recreational cannabis
- Adjusted EBITDA is one of the key metrics the Company uses in assessing its financial performance and ability to drive return on investment for shareholders
- Sales and Marketing and General and Administrative Expenses (“SG&A”):
- In 2019 $33.2 million or 41% of net revenue compared to 88% in 2018 is reflective of management’s disciplined approach to discretionary spending despite being in a high growth period
- In Q4 $13.9 million or 85% of net revenue compared to $3.6 million or 112% of net revenue in Q4 2018 as the Company scaled up staffing and marketing activities for legalization of adult-use recreational cannabis sales
- Net Income (Loss) from Continuing Operations:
- In 2019 net loss of $9.5 million or $(0.07) per share (diluted basis) compared to net income of $22.1 million or $0.17 per share in 2018 largely due to non-cash fair value changes to biological assets and inventories
- Q4 2019 net loss of $22.5 million or $(0.14) per share on a diluted basis compared to Q4 2018 net income of $18.2 million or $0.12 per share largely due to non-cash fair value changes to biological assets and inventories
Key Commentary on Q4 2019 Results vs Q3 2019
- The lack of a sufficient retail network and slower than expected store openings in Ontario continued to impact revenue growth in Q4 2019 and were further exacerbated by increased industry supply. Quarter to quarter revenue is expected to continue to be volatile due to the timing of large pipeline orders for Ontario, in particular, where there is a centralized distribution model and where store additions are difficult to forecast.
- Q4 2019 net revenue of $16.3 million compared to Q3 2019 net revenue of $24.8 million. As previously reported in the Company’s corporate update, Q4 net revenue reflected about $20.0 million of sales and about $3.7 million in a provision for product returns and pricing adjustments. The majority of the provision was largely related to two slower selling stock-keeping units (SKUs) sold to the Ontario Cannabis Store (OCS), comprised of a bespoke order of lower THC dried flower intended to fulfill a supply gap in the market earlier this year and THC oils which have seen less than anticipated demand in the adult-use recreational market.
- As expected, Q4 2019 cash and “all-in” costs of cultivation of $0.66 and $0.94 per gram of dried flower harvested⁶, respectively, decreased from $0.95 and $1.29 per gram in Q3 2019 as yield per plant increased in line with historical levels following a temporary decrease in Q3 2019 (Q4 2019: 148 grams compared to 110 grams in Q3 2019). As a result, the Q4 2019 harvest increased to 7,434 kg from 6,052 kg in Q3 2019.
- Q4 cost of sales and indirect production increased to $15.5 million from $12.5 million in Q3 2019 largely due to higher cost product sold in Q4 and $1.6 million in inventory adjustments and write-offs related to legacy packaging and product that did not meet quality standards or expired.
- Aside from the indirect production costs on a per unit basis there was generally a higher cost of product sold in Q4 (compared to Q3) and this was primarily due to the following factors:
- As previously disclosed and described above, yield per plant temporarily decreased in Q3 2019 driving higher costs of cultivation capitalized to inventory which flowed through cost of sales in Q4 2019 (due to the lag between harvesting and sales shipments); and
- Higher post harvest costs including greater cost allocations capitalized to inventory in Q3 and Q4 of 2019 as the Company ramped up staffing without the benefit of full efficiencies from scale realized.
- Q4 gross margin before fair value changes to biological assets and inventory decreased to $0.7 million or 5% from Q3 2019 gross margin before fair value changes to biological assets and inventories sold of $12.3 million or 50% largely due to lower net revenue and higher cost of sales and indirect production costs as described above.
- Q4 gross margin of negative $11.1 million compared to Q3 gross margin of negative $0.2 million, largely due to fair value changes in biological assets and inventories. Biological assets and inventory sold are highly sensitive to many judgmental inputs. As a result of higher post-harvesting costs (including packaging) and better visibility on wholesale pricing on extractable cannabis the Company has adjusted some of the inputs used which has resulted in a reduction in the carrying value per unit in biological assets and some of the inventory categories.
- Q4 negative adjusted EBITDA⁷ of $7.9 million compared to Q3 adjusted EBITDA of $7.7 million. Q4 negative adjusted EBITDA was impacted by lower adjusted gross margin (described above) and higher SG&A compared to Q3 2019.
- Q4 SG&A of $13.9 million or 85% as a percentage of net revenue (85%) was higher than Q3 higher than Q3 2019 SG&A of $9.1 million or 37% largely due to lower revenue in part from sales returns and adjustments combined with higher than expected expenses – the Company currently believes this is an anomaly and SG&A as a percentage of net revenue is expected to decrease in Q1 Fiscal 2020 and beyond.
Adult-Use Recreational Launch 2.0 (“Rec 2.0”) – Derivative and Edible Products
- The Company has chosen to initially focus on the two most popular product forms based on US state sales data: vaporizer pens and edible products.
- Organigram submitted new product notifications to Health Canada for a comprehensive vape pen portfolio and cannabis infused chocolates in October 2019.
- Organigram remains on track to launch some vape pens in December 2019. The Company expects substantial construction of additional in-house extraction capacity and expanded vape pen filling space to be completed by the end of calendar 2019. However, the Company has the capacity to fill and package vaporizer pens in its existing facility ahead of the licensing of Phase 5.
- During the quarter, Organigram announced two innovative partnerships with two vaporizer hardware and technology companies, PAX Labs, Inc. and the Feather Company-branded goods to offer vaporizer pens to all its provincial partners.
- As expected, the Company took delivery of its high speed, high capacity, fully automated chocolate production line in October 2019. Installation has been almost completed, and the Company expects commissioning and licensing in time for initial sales in Q1 calendar 2020. The line has a state-of-the-art chocolate molding line and a fully integrated packaging line that includes advanced engineering, robotics, high-speed labeling and automated carton packing.
- The Company now expects to launch powdered beverage products in Q2 calendar 2020 based on expected licensing timing for the production area and equipment delivery and commissioning schedules.
- As previously announced, Organigram has developed a proprietary nano-emulsification technology that is anticipated to provide an initial onset of the effects of the cannabinoids within 10 to 15 minutes. The emulsion process developed by the Organigram team generates micro-particles that are very small and uniform, which it expects will translate to an absorption and onset of effect that is rapid, reliable and controlled. The Company believes the nano-emulsion technology is stable to temperature variations, mechanical disturbance, salinity, pH and sweeteners. The Company’s researchers have also recently developed a way to transform this emulsification system into a solid form, turning it into a dissolvable powder. This shelf stable, water-compatible, flavorless nano-emulsion formulation is also expected to provide an initial onset of effect within 10 to 15 minutes if used in any beverage. The powdered formulation will offer consumers a measured dose of cannabinoids which they can then add to the appropriate beverage of their choice, while also offering the discretion, portability and shelf life expected of a dry powder formulation.
Update on Phase 4C Expansion
- Since the Q3 2019 earnings release, the Company received Health Canada licensing approval for an additional 17 grow rooms for incremental target production capacity of about 15,000 kg per year of dried flower and sweet leaf. This brings the Company’s total licensed target production capacity to 76,000 kg per year8.
- The Company also recently submitted the licensing amendment for the remaining 16 rooms in Phase 4B which represent about 13,000 kg per year of additional target production capacity. Once the approval is received, total target production capacity is expected to be 89,000 kg per year⁸.
- Construction of Phase 4C, the final phase of the Moncton Campus expansion (related to cultivation), is estimated at 70% complete (vs. 50% at August 31, 2019). The Company has decided to delay final completion, previously targeted for calendar 2019 year-end, until there is more clarity on the timing and magnitude of the retail network expansion.
- As such, the Company’s management can more effectively manage and prioritize cash flows and it also offers us optionality to use a portion of the space for other opportunities (should strategic or market factors dictate).
- The Company can complete the remaining construction on Phase 4C in a short timeframe and may choose to do so once there is more visibility on the retail expansion.
- If and when the Company decides to complete 100% of Phase 4C for cultivation as currently designed, the Moncton Campus facility is expected to have a target production capacity of 113,000 kg per year8 of dried flower and sweet leaf, once fully licensed and operational.
Phase 5 Under Refurbishment
- The Company is taking an already constructed 56,000 square foot footprint within its existing facility and turning it into a multi-functional space (“Phase 5”) with design specifications to European Union GMP standards.
- Phase 5, once fully licensed and operational, will add significant functionality to the Moncton Campus including additional post-harvesting rooms (including drying rooms), additional extraction capacity, and a dedicated derivatives and edibles facility.
- Each area of Phase 5 has different expected construction completion dates, however, primary construction was completed on schedule in October 2019 and the overall schedule remains on track.
- The estimated total capital cost is now expected to be in the range of $60 to $65 million8 (from the previous estimate of $48 million) primarily due to a proposed additional 18,000 square feet of production space created by utilizing a second level, increased European GMP design costs as well as multiple automation projects (not originally contemplated) designed to reduce reliance on manual labour and lower operating costs in the long run. The estimate to complete was approximately $41 million at fiscal year-end.
- Phase 5 plans include expanded vaporizer pen filling and automated packaging, additional extraction by both CO2 and hydrocarbons as well as additional areas for formulation including short path distillation for edibles and vaporizer pen formulas. In addition, Phase 5 will include a both a chocolate production and powdered drink mixing and packaging line to support the Company’s plans to launch a variety of these products.
Outlook
- The Canadian market is positioned for significant growth with additional retail store openings planned in the largest markets of Ontario and Quebec collectively representing over 60% of the Canadian population.
- Legalization of edible and derivative products is also expected to significantly expand the legal market from its current state.
- Organigram has and continues to build excised finished product across a variety of SKUs and is ready to onboard the addition of the second wave of Ontario retailers. These stores should triple the existing retail network currently available in Ontario. The first few of these new stores are expected to open shortly. Ontario’s October 2019 announcement to expand the retail network beyond these stores should be an important catalyst to drive further growth for Organigram and the industry. The Société québécois du cannabis also announced plans to double its number of stores and Alberta’s robust network of about 277 stores currently continues to grow to meet consumer demand.
- Q1 2020 net revenue is expected to be higher than Q4 2019 on increased sales to provinces and higher wholesale revenue.
- The Company expects increased efficiencies and economies of scale from more capacity to decrease cultivation costs in Q1 2020 from Q4 2019. Labour costs are not expected to increase commensurate with production, processing and sales volume.
- Q1 2020 gross margin before fair value changes to biological assets and inventories is anticipated to be higher than Q4 2019 on higher net revenue and lower cost of sales and indirect production costs, including from greater expected efficiencies of scale, and an increased proportion of higher margin wholesale revenue.
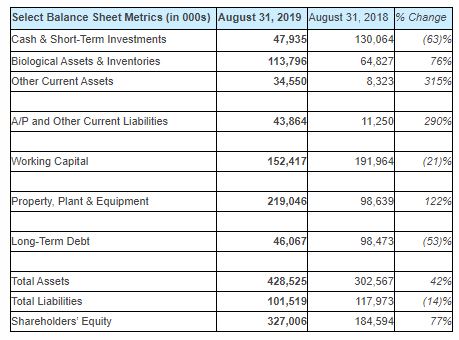
Liquidity and Capital
- As at 2019 fiscal year-end, Organigram had $47.9 million in cash and short-term investments and generated positive adjusted EBITDA⁹ of $19.9 million for the year.
- The Company reported approximately $50 million in current and long-term debt, which primarily represents the carrying value of its term loan in its credit facility with BMO and a syndicate of lenders. Subsequent to Q4 2019, an additional $15 million was drawn on its term loan leaving about $50 million in available capacity of the total term loan of $115 million. The Company also has a revolver of up to $25 million available to be drawn against specified receivables.
- On November 15, 2019, the Company amended its credit facility with BMO to: i) extend the final draw deadline of the term loan from November 30, 2019 to March 31, 2020; ii) postpone the commencement of principal repayments on the term loan to May 31, 2020; and iii) realign the financial covenants structure, effective November 30, 2019, to be more consistent with industry norms up to and including May 31, 2020, which will also provide the Company with greater flexibility around the timing and quantum of incremental draws. The financial covenants will revert to the original structure on August 31, 2020.
- Included in the facility is an uncommitted option to increase the term loan and/or revolving debt by an incremental $35 million to a total of $175 million, subject to agreement by BMO and the syndicate of lenders and satisfaction of certain legal and business conditions.
- On November 4, 2019, the Company filed a preliminary base-shelf prospectus for an amount up to $175 million through the issuance of common shares, preferred shares, debt securities, subscription receipts, warrants or units. The purpose of filing the base-shelf prospectus is to shorten the timeline to raise funds for growth opportunities and working capital.
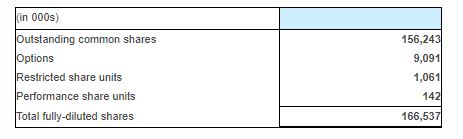
Capital Structure
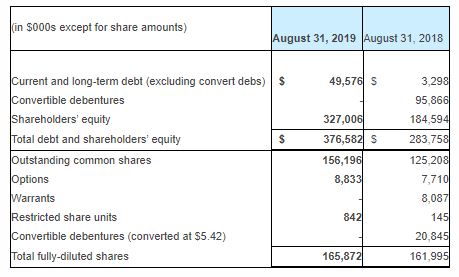
Outstanding basic and fully diluted share count as at November 23, 2019 is as follows:
Fourth Quarter and 2019 Fiscal Year Conference Call
The Company is scheduled to report its fourth quarter and full year earnings results for its fiscal year ended August 31, 2019 on Monday, November 25, 2019 before market open. The Company will host a conference call to discuss its results:
Date: November 25, 2019
Time: 8:00 a.m. Eastern Time
Toll Free (North America) Dial-In Number: 1-866-211-4093
International Dial-In Number: 647-689-6727
Webcast: https://event.on24.com/wcc/r/2081952/4BA98522DEFFE3F5758620EC23384882
A replay of the webcast will be available within 24 hours after the conclusion of the call at https://www.organigram.ca/investors and will be archived for a period of 90 days following the call.
Non-IFRS Financial Measures
This news release refers to certain financial performance measures that are not defined by and do not have a standardized meaning under International Financial Reporting Standards (“IFRS”) as issued by the International Accounting Standards Board. These non-IFRS financial performance measures are defined below. Non-IFRS financial measures are used by management to assess the financial and operational performance of the Company. The Company believes that these non-IFRS financial measures, in addition to conventional measures prepared in accordance with IFRS, enable investors to evaluate the Company’s operating results, underlying performance and prospects in a similar manner to the Company’s management. As there are no standardized methods of calculating these non-IFRS measures, the Company’s approaches may differ from those used by others, and accordingly, the use of these measures may not be directly comparable. Accordingly, these non-IFRS measures are intended to provide additional information and should not be considered in isolation or as a substitute for measures of performance prepared in accordance with IFRS.
Adjusted EBITDA
This is a non-IFRS measure and the Company calculates adjusted EBITDA from continuing operations as net income (earnings) before: interest expense, net of investment income; income tax; depreciation, amortization, impairment, and gain (loss) on disposal of PP&E (per the statement of cash flows); share-based compensation (per the statement of cash flows); share of loss and impairment loss from investments in associates; unrealized loss (gain) on changes in fair value of contingent consideration; expenditures incurred in connection with the NASDAQ cross-listing; and the fair value adjustment to biological assets and inventory. Management believes the exclusion of the fair value adjustment is an alternative representation of performance. The fair value adjustment is a non-cash gain (loss) and is based on the valuation of biological assets and inventory using a fair value less cost to sell model. The most directly comparable measure to adjusted EBITDA (excluding fair value adjustment to biological assets and inventory) calculated in accordance with IFRS is net income (loss) from continuing operations.
About Organigram Holdings Inc.
Organigram Holdings Inc. is a NASDAQ Global Select Market and a Toronto Stock Exchange (“TSX”) listed company whose wholly owned subsidiary, Organigram Inc., is a licensed producer of cannabis and cannabis-derived products in Canada.
Organigram is focused on producing high-quality, indoor-grown cannabis for patients and adult recreational consumers in Canada, as well as developing international business partnerships to extend the Company’s global footprint. Organigram has also developed a portfolio of adult use recreational cannabis brands including The Edison Cannabis Company, Ankr Organics and Trailblazer. Organigram’s primary facility is located in Moncton, New Brunswick and the Company is regulated by Health Canada under the Cannabis Act (Canada) and the Cannabis Regulations (Canada).
¹Adjusted EBITDA is a non-IFRS financial measure not defined by and does not have any standardized meaning under IFRS; please refer to page 10 of this press release for definitions and a reconciliation to IFRS.
²Based on the Company’s analysis of available data including, but not limited to, market share from select provinces and various public sources
³Sales and marketing and general and administrative expenses (excludes non-cash share-based compensation and impairment loss)
⁴Adjusted EBITDA is a non-IFRS financial measure not defined by and does not have any standardized meaning under IFRS; please refer to page 10 of this press release for definitions and a reconciliation to IFRS.
⁵Adjusted EBITDA is a non-IFRS financial measure not defined by and does not have any standardized meaning under IFRS; please refer to page 10 of this press release for definitions and a reconciliation to IFRS.
⁶Cash and “all-in” costs of cultivation per gram of dried flower harvested are non-IFRS measures that are not defined by and do not have any standardized meaning under IFRS. “Cost of cultivation” per gram harvested includes “cash” costs such as direct labour, direct materials and manufacturing overhead (e.g. maintenance) as well as “non-cash” expenses such as employee share-based compensation for cultivation employees and depreciation related to buildings and equipment of the production facility. Cost of cultivation does not include packaging costs, which are added to arrive at the cost for inventory, nor distribution costs (shipping), both of which are included in the cost of sales (please note that the Company previously included shipping expense in “sales and marketing” in the statement of operations but revised this presentation in Q1 Fiscal 2019). Thus, readers are cautioned against comparing cost of cultivation per gram harvested with cost of sales for the same period(s) for at least two reasons: (1) Cost of sales includes packaging costs and distribution (shipping) costs which “Cost of cultivation” does not, and (2) there is a delay between when product is harvested and when it is sold. Sometimes that delay is one or two quarters (and longer with extraction material). Cost of cultivation also does not include indirect production costs, which are expensed directly against gross margin.
⁷Adjusted EBITDA is a non-IFRS financial measure not defined by and does not have any standardized meaning under IFRS; please refer to page 10 of this news release for definitions and a reconciliation to IFRS amounts.
⁸Target production capacity once licensed and fully operational; several factors can cause actual capacity and cost to differ from estimates. See “Risks and Uncertainties” at the end of this release.
⁹Adjusted EBITDA is a non-IFRS financial measure not defined by and does not have any standardized meaning under IFRS; please refer to page 10 of this press release for definitions and a reconciliation to IFRS.
For fact-based information on Organigram, view the company’s sponsored Investor Dashboard.