![]()
ScottsMiracle-Gro Announces Record Second Quarter U.S. Consumer Sales; Lawn & Garden Demand Gaining Ground After Weather-Driven Delays
Company announces Hawthorne acquisition of Cyco, Australia-based nutrient brand
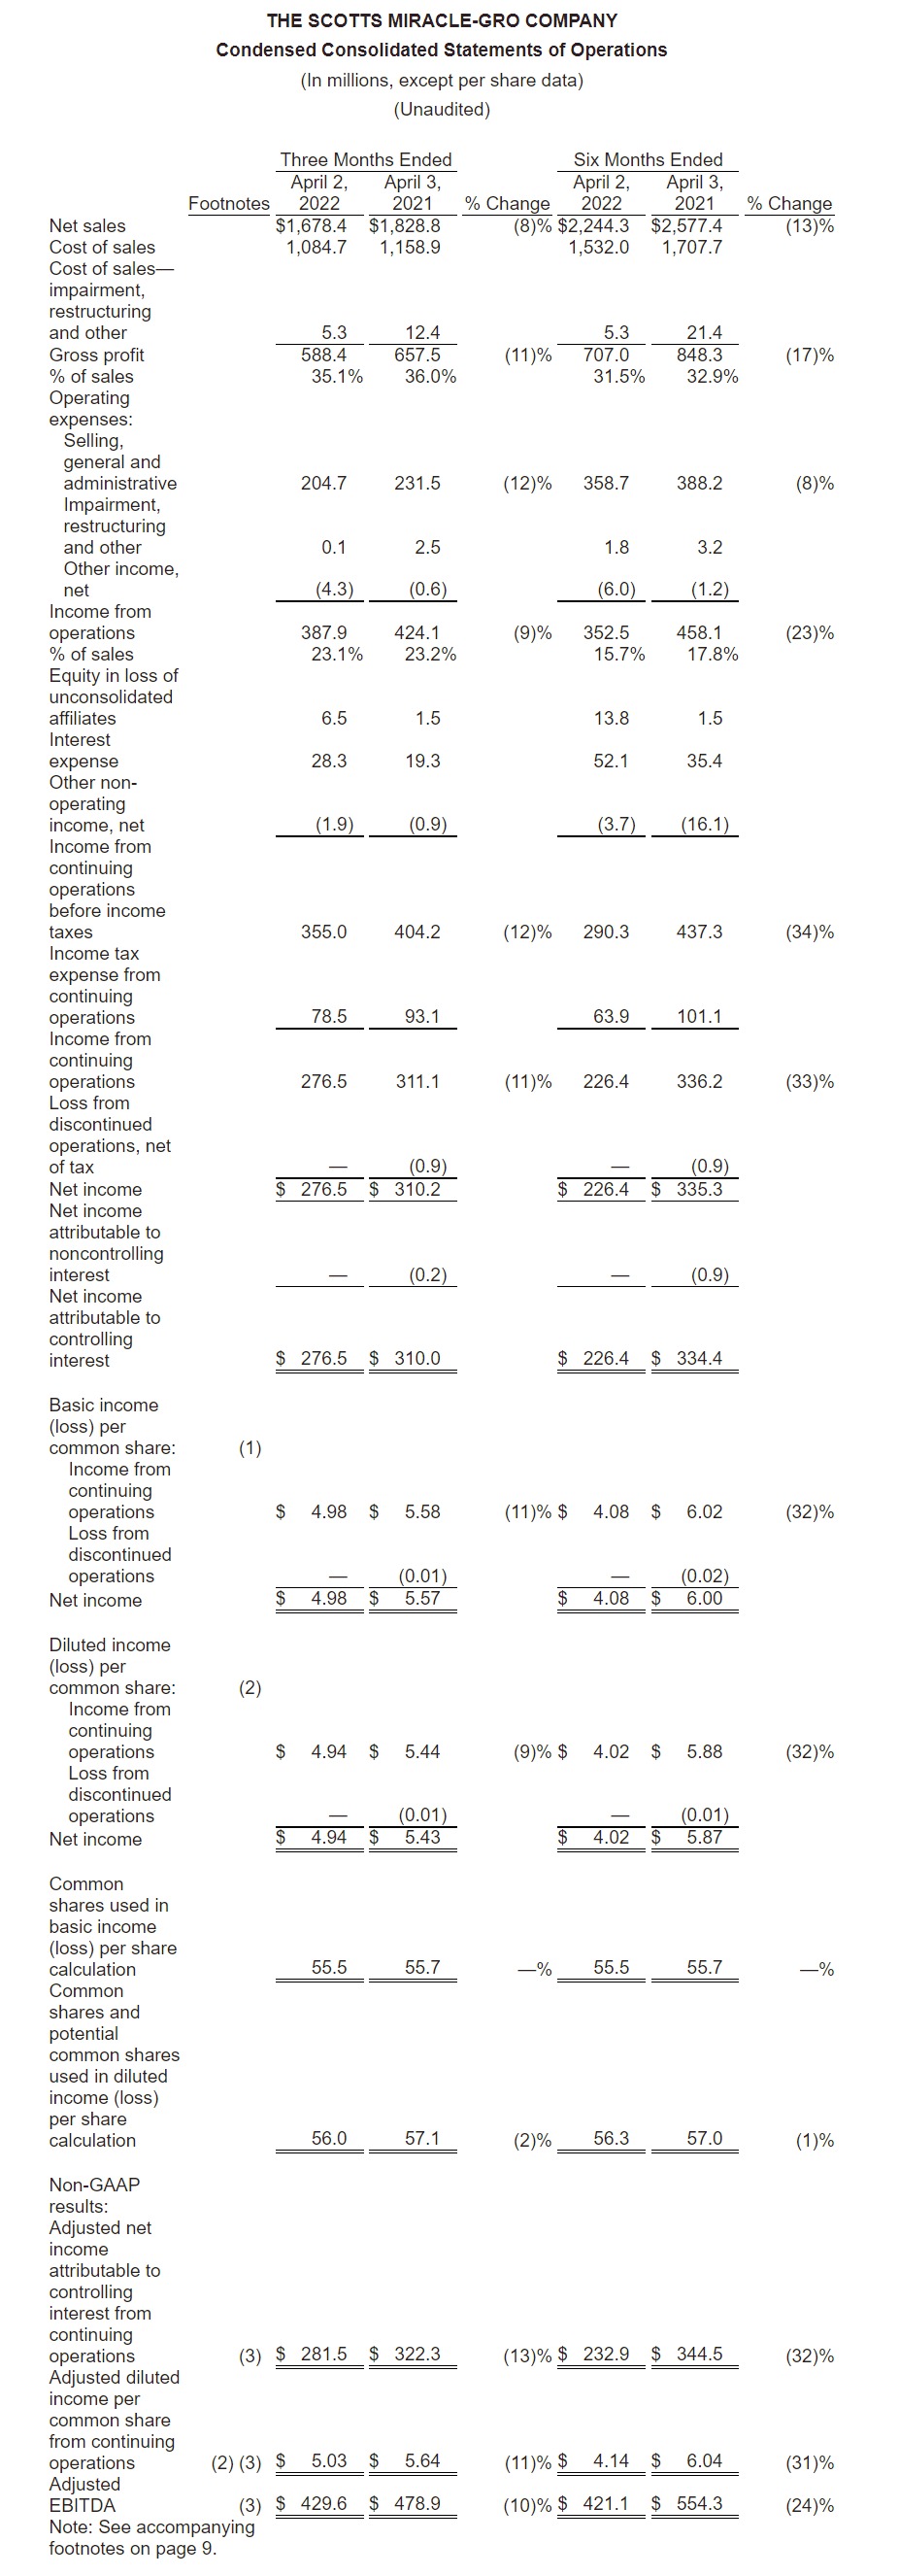
- GAAP EPS: $4.94 versus $5.44; non-GAAP adjusted EPS of $5.03 versus $5.64
- Consumer POS down 12% entering May with increasing momentum in most markets
- Sales outlook for U.S. Consumer and Hawthorne adjusted to low end of guidance
- Surge in commodities, lower fixed cost leverage expected to pressure EPS in second half
- Productivity enhancement efforts launched to reduce costs, improve margins
- Management to provide update on adjusted EPS outlook in early June
MARYSVILLE, Ohio, May 03, 2022 (GLOBE NEWSWIRE) — The Scotts Miracle-Gro Company (NYSE: SMG), the world’s leading marketer of branded consumer lawn and garden as well as indoor and hydroponic growing products, today announced record second quarter sales in its U.S. Consumer segment driven by continued support from its major retail partners. The growth was offset by an expected decline in Hawthorne sales, leading to company-wide sales that were 8 percent lower than the same period a year ago.
For the quarter ended April 2, 2022, GAAP earnings from continuing operations were $4.94 per diluted share compared with $5.44 per diluted share in the prior year. Non-GAAP adjusted earnings, which exclude impairment, restructuring and other non-recurring items, and are the basis of the Company’s financial guidance, were $5.03 per diluted share compared with $5.64 a year ago.
On a fiscal year-to-date basis entering May, consumer purchases of the Company’s lawn and garden products at its largest four retailers in the U.S. are down 12 percent from the same period a year ago. The Company said the category gained significant momentum in recent weeks after a late break to spring and planned delays of promotional activity until after the Easter holiday.
Spring weather, frankly, has been lousy in most markets and the season broke about two to three weeks later than normal. Fortunately, consumer purchases have gained considerable ground in recent weeks. For example, key early-breaking markets in the south are down mid-single digits entering May after being down double digits two weeks earlier.
The combination of improved weather, strong retailer promotions through Memorial Day, and favorable comparisons for the balance of the season should be tailwinds for the rest of the year. Still, we now believe the low end of our sales guidance range for U.S. Consumer of plus-or-minus 2 percent from last year’s performance is our most likely outcome.
At Hawthorne, while organic sales in the second quarter were in line with what we expected, recent trends also lead us to conclude the low end of our sales guidance range is a best-case outcome for this business.
 Jim Hagedorn, chairman and chief executive officer
We are taking steps to proactively reduce costs within the Hawthorne operation with a focus on returning the business to at least its previous level of profitability as quickly as possible.
The Company said its previous guidance of $8 or more of non-GAAP adjusted earnings per share is likely unattainable. Management currently expects to provide an update to the investment community the week of June 6, 2022.
“A combination of external factors that evolved over the past two months now make it unlikely for us to meet our previous earnings target,” said Cory Miller, executive vice president and chief financial officer. “However, with one quarter of our annual POS expected in the next six weeks, any updated earnings target we developed right now would be based on a set of hypothetical assumptions. So, we are best served to be patient and provide a more informed update a few weeks from now.”
Second quarter details
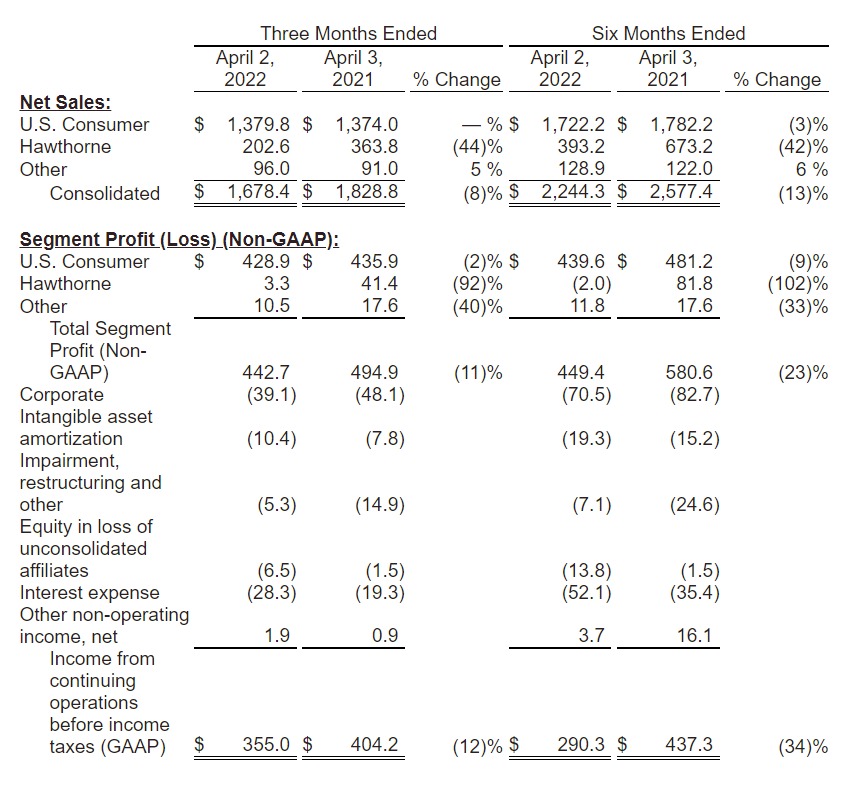
For the fiscal second quarter, the Company reported sales of $1.68 billion, down 8 percent from $1.83 billion a year earlier. U.S. Consumer segment sales increased slightly to $1.38 billion. Sales for the Hawthorne segment decreased 44 percent to $202.6 million.
The company-wide gross margin rate was 35.1 percent on a GAAP basis and 35.4 percent on a non-GAAP adjusted basis compared with a rate of 36.0 percent and 36.6 percent, respectively, a year ago. As expected, while higher commodity and distribution costs were largely offset by pricing, lower fixed cost leverage was the primary cause of the decline.
Selling, general and administrative expenses (SG&A) declined 12 percent to $204.7 million primarily due to lower accruals for variable compensation and other expense control measures.
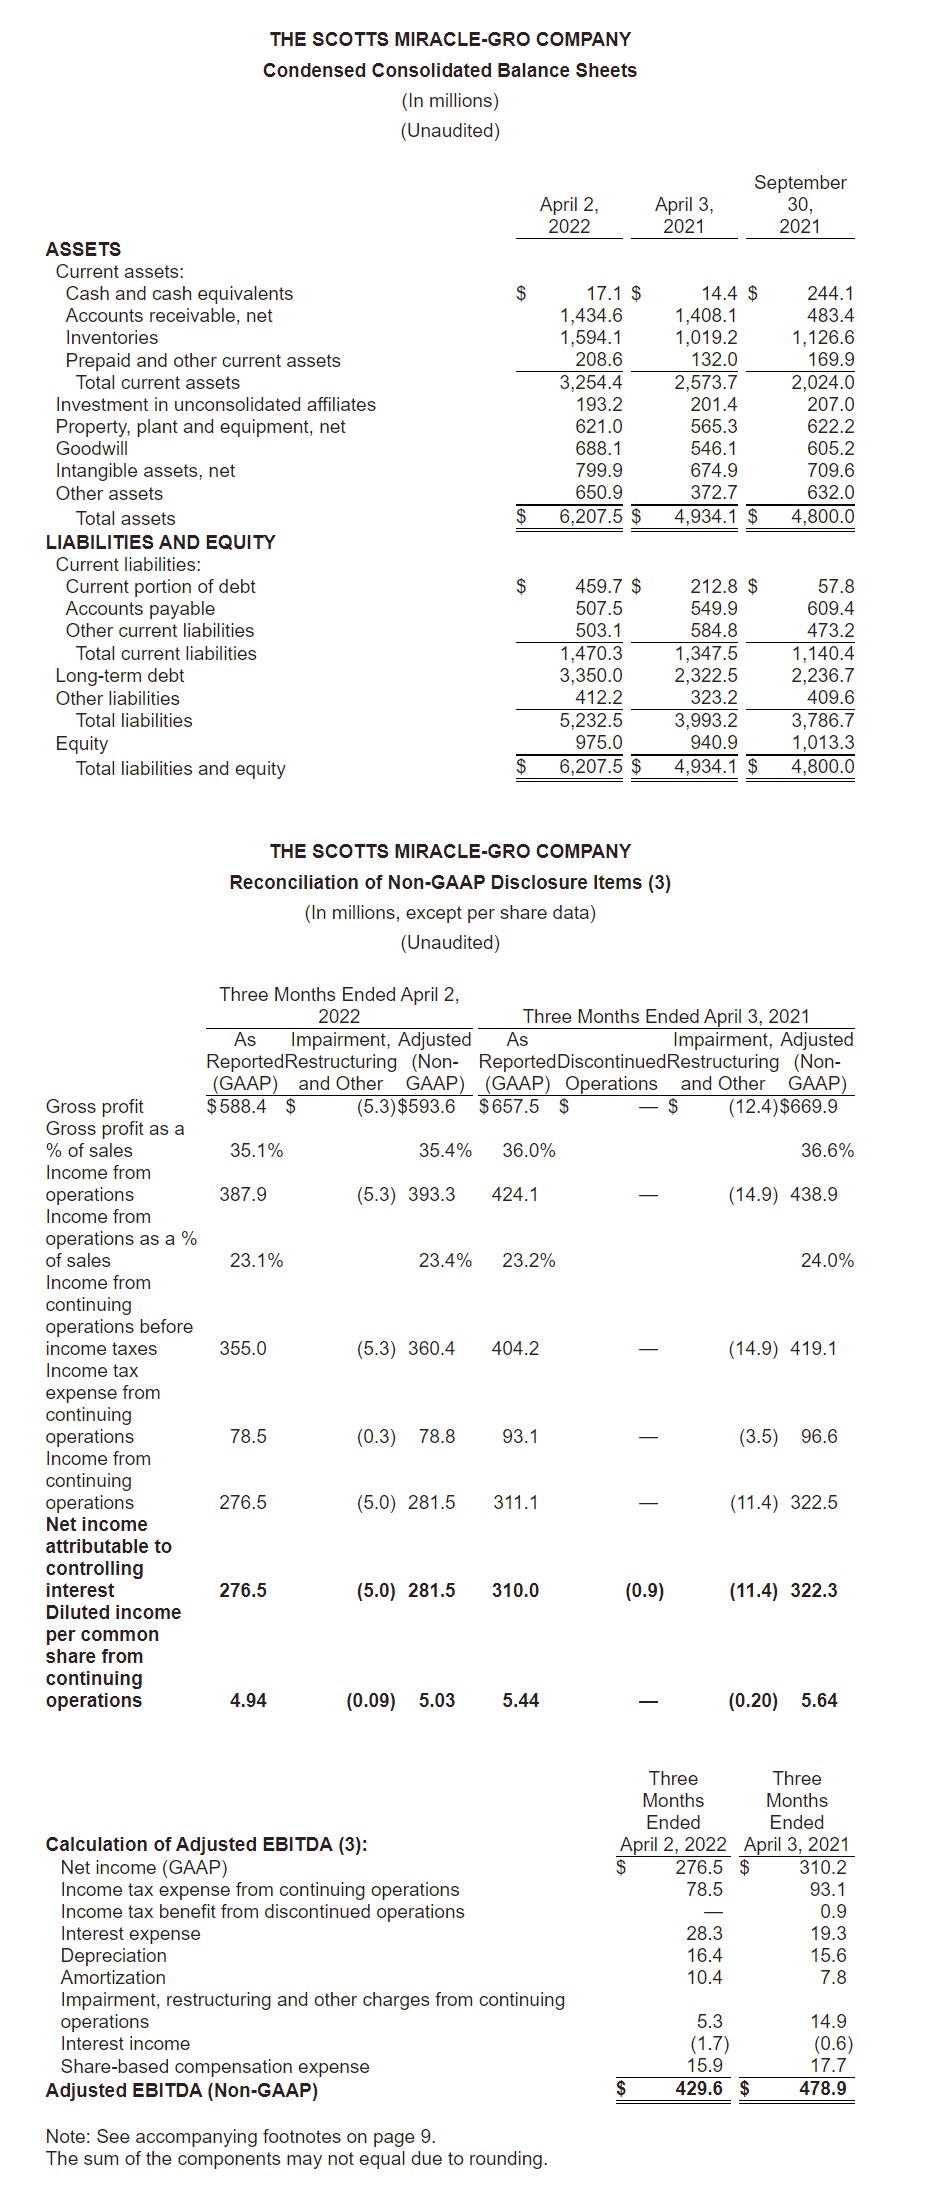
On a company-wide basis, GAAP income from continuing operations was $276.5 million, or $4.94 per diluted share compared with $311.1 million, or $5.44 per diluted share, for the second quarter of fiscal 2021. These results include impairment, restructuring and other non-recurring items. Excluding these items, non-GAAP adjusted earnings were $281.5 million, or $5.03 per diluted share, compared with $322.3 million, or $5.64 per diluted share.
Year-to-date details
For the first six months of fiscal 2022, the Company reported sales of $2.24 billion, down 13 percent from $2.58 billion a year earlier. U.S. Consumer segment sales decreased 3 percent to $1.72 billion. Sales for the Hawthorne segment decreased 42 percent to $393.2 million.
The company-wide gross margin rate was 31.5 percent on a GAAP basis and 31.7 percent on a non-GAAP adjusted basis compared with a rate of 32.9 percent and 33.7 percent, respectively, a year ago. SG&A decreased 8 percent to $358.7 million.
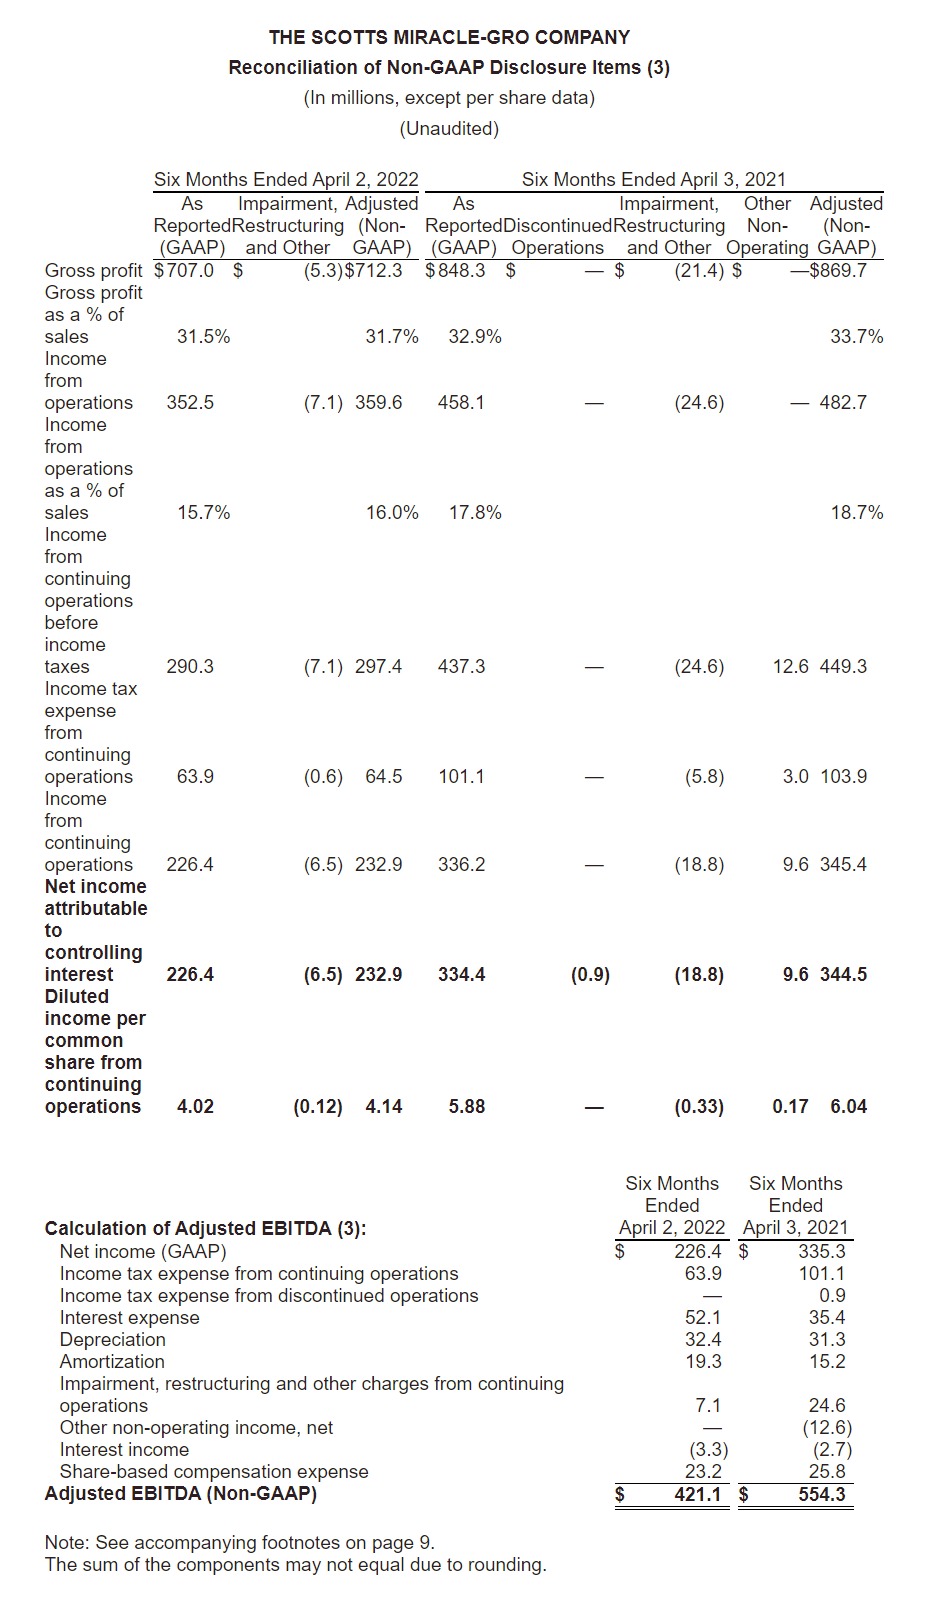
On a company-wide basis, GAAP income from continuing operations was $226.4 million, or $4.02 per diluted share, compared with $336.2 million, or $5.88 per diluted share, for the first six months of fiscal 2021. Excluding impairment, restructuring and other non-recurring items, non-GAAP adjusted earnings were $232.9 million, or $4.14 per diluted share, compared with $344.5 million, or $6.04 per diluted share, last year.
“Over the last two years, the continued pressure from commodity prices has led to a significant margin decline despite multiple pricing actions,” Hagedorn said. “It has become clear we must take other steps to get our margins back on the right track and we’ll begin doing so immediately. In the second half of the year, we will take action to reduce the size of our supply chain network at Hawthorne. We also will focus on reducing inventory levels, improving cash flow, and implementing productivity and restructuring initiatives in the U.S. Consumer business and corporate functions.”
Acquisition of Cyco
Separately, the Company announced that Hawthorne has acquired Australia-based Cyco, for $34 million plus contingent consideration of up to $10 million. The transaction marks the fifth Hawthorne acquisition in the past year.
Cyco is a leading brand of premium nutrients, additives and growing media products that are used by growers of all sizes in the hydroponic market. Hawthorne has been the exclusive U.S. distributor of Cyco products, which also are sold primarily in Canada and Australia through select retailers and distributors.
Under the terms of the deal, Hawthorne has acquired the brand and business assets of Cyco. Although the acquisition is small, about $15 million in annualized sales, Cyco is a strategic move to expand Hawthorne’s Signature line of high-quality and high-performing nutrients and growing media, including General Hydroponics, Botanicare, Terpinator and Mother Earth. Hawthorne intends to expand the availability of the Cyco brand in North America and, through an arrangement with the current Australian distributor, will make other Hawthorne products available to hydroponic growers in that market.
Conference Call and Webcast Scheduled for 9 a.m. ET Today, May 3
The Company will discuss results during a webcast and conference call today at 9:00 a.m. ET. To participate in the conference call, please call 1-888-378-4398 (Participant Code: 490745). A replay of the call can be heard by calling 1-888-203-1112 (Replay Passcode: 9718563). The replay will be available for 15 days. A live webcast of the call and the press release will be available on the Company’s investor relations website at http://investor.scotts.com. An archive of the press release and any accompanying information will remain available for at least a 12-month period.
About ScottsMiracle-Gro
With approximately $4.9 billion in sales, the Company is one of the world’s largest marketers of branded consumer products for lawn and garden care. The Company’s brands are among the most recognized in the industry. The Company’s Scotts®, Miracle-Gro® and Ortho® brands are market-leading in their categories. The Company’s wholly-owned subsidiary, The Hawthorne Gardening Company, is a leading provider of nutrients, lighting and other materials used in the indoor and hydroponic growing segment. Another wholly-owned subsidiary, The Hawthorne Collective, has been established to invest in emerging areas of the cannabis industry. For additional information, visit us at www.scottsmiraclegro.com.
THE SCOTTS MIRACLE-GRO COMPANY
Segment Results
(In millions)
(Unaudited)
The Company divides its operations into three reportable segments: U.S. Consumer, Hawthorne and Other. U.S. Consumer consists of the Company’s consumer lawn and garden business in the United States. Hawthorne consists of the Company’s indoor and hydroponic gardening business. Other primarily consists of the Company’s consumer lawn and garden business outside the United States. This identification of reportable segments is consistent with how the segments report to and are managed by the chief operating decision maker of the Company. In addition, Corporate consists of general and administrative expenses and certain other income and expense items not allocated to the business segments.
The performance of each reportable segment is evaluated based on several factors, including income (loss) from continuing operations before income taxes, amortization, impairment, restructuring and other charges (“Segment Profit (Loss)”), which is a non-GAAP financial measure. Senior management uses Segment Profit (Loss) to evaluate segment performance because they believe this measure is indicative of performance trends and the overall earnings potential of each segment.
The following tables present financial information for the Company’s reportable segments for the periods indicated:
THE SCOTTS MIRACLE-GRO COMPANY
Footnotes to Preceding Financial Statements
(1) Basic income (loss) per common share amounts are calculated by dividing income (loss) attributable to controlling interest from continuing operations, income (loss) from discontinued operations and net income (loss) attributable to controlling interest by the weighted average number of common shares outstanding during the period.
(2) Diluted income (loss) per common share amounts are calculated by dividing income (loss) attributable to controlling interest from continuing operations, income (loss) from discontinued operations and net income (loss) attributable to controlling interest by the weighted average number of common shares, plus all potential dilutive securities (common stock options, performance shares, performance units, restricted stock and restricted stock units) outstanding during the period.
(3) Reconciliation of Non-GAAP Measures
Use of Non-GAAP Measures
To supplement the financial measures prepared in accordance with U.S. generally accepted accounting principles (“GAAP”), the Company uses non-GAAP financial measures. The reconciliations of these non-GAAP financial measures to the most directly comparable financial measures calculated and presented in accordance with GAAP are shown in the tables above. These non-GAAP financial measures should not be considered in isolation from, or as a substitute for or superior to, financial measures reported in accordance with GAAP. Moreover, these non-GAAP financial measures have limitations in that they do not reflect all the items associated with the operations of the business as determined in accordance with GAAP. Other companies may calculate similarly titled non-GAAP financial measures differently than the Company, limiting the usefulness of those measures for comparative purposes.
In addition to GAAP measures, management uses these non-GAAP financial measures to evaluate the Company’s performance, engage in financial and operational planning and determine incentive compensation because it believes that these measures provide additional perspective on and, in some circumstances are more closely correlated to, the performance of the Company’s underlying, ongoing business.
Management believes that these non-GAAP financial measures are useful to investors in their assessment of operating performance and the valuation of the Company. In addition, these non-GAAP financial measures address questions routinely received from analysts and investors and, in order to ensure that all investors have access to the same data, management has determined that it is appropriate to make this data available to all investors. Non-GAAP financial measures exclude the impact of certain items (as further described below) and provide supplemental information regarding operating performance. By disclosing these non-GAAP financial measures, management intends to provide investors with a supplemental comparison of operating results and trends for the periods presented. Management believes these non-GAAP financial measures are also useful to investors as such measures allow investors to evaluate performance using the same metrics that management uses to evaluate past performance and prospects for future performance. Management views free cash flow as an important measure because it is one factor used in determining the amount of cash available for dividends and discretionary investment.
Exclusions from Non-GAAP Financial Measures
Non-GAAP financial measures reflect adjustments based on the following items:
- Impairments, which are excluded because they do not occur in or reflect the ordinary course of the Company’s ongoing business operations and their exclusion results in a metric that provides supplemental information about the sustainability of operating performance.
- Restructuring and employee severance costs, which include charges for discrete projects or transactions that fundamentally change the Company’s operations and are excluded because they are not part of the ongoing operations of its underlying business, which includes normal levels of reinvestment in the business.
- Costs related to refinancing, which are excluded because they do not typically occur in the normal course of business and may obscure analysis of trends and financial performance. Additionally, the amount and frequency of these types of charges is not consistent and is significantly impacted by the timing and size of debt financing transactions.
- Discontinued operations and other unusual items, which include costs or gains related to discrete projects or transactions and are excluded because they are not comparable from one period to the next and are not part of the ongoing operations of the Company’s underlying business.
The tax effect for each of the items listed above is determined using the tax rate and other tax attributes applicable to the item and the jurisdiction(s) in which the item is recorded.
Definitions of Non-GAAP Financial Measures
The reconciliations of non-GAAP disclosure items include the following financial measures that are not calculated in accordance with GAAP and are utilized by management in evaluating the performance of the business, engaging in financial and operational planning, determining incentive compensation and determining the amount of cash available for dividends and discretionary investments, and by investors and analysts in evaluating performance of the business:
Adjusted gross profit: Gross profit excluding impairment, restructuring and other charges / recoveries.
Adjusted income (loss) from operations: Income (loss) from operations excluding impairment, restructuring and other charges / recoveries.
Adjusted income (loss) from continuing operations before income taxes: Income (loss) from continuing operations before income taxes excluding impairment, restructuring and other charges / recoveries, costs related to refinancing and certain other non-operating income / expense items.
Adjusted income tax expense (benefit) from continuing operations: Income tax expense (benefit) from continuing operations excluding the tax effect of impairment, restructuring and other charges / recoveries, costs related to refinancing and certain other non-operating income / expense items.
Adjusted income (loss) from continuing operations: Income (loss) from continuing operations excluding impairment, restructuring and other charges / recoveries, costs related to refinancing and certain other non-operating income / expense items, each net of tax.
Adjusted net income (loss) attributable to controlling interest from continuing operations: Net income (loss) attributable to controlling interest excluding impairment, restructuring and other charges / recoveries, costs related to refinancing, certain other non-operating income / expense items and discontinued operations, each net of tax.
Adjusted diluted income (loss) per common share from continuing operations: Diluted net income (loss) per common share from continuing operations excluding impairment, restructuring and other charges / recoveries, costs related to refinancing and certain other non-operating income / expense items, each net of tax.
Adjusted EBITDA: Net income (loss) before interest, taxes, depreciation and amortization as well as certain other items such as the impact of the cumulative effect of changes in accounting, costs associated with debt refinancing and other non-recurring or non-cash items affecting net income (loss). The presentation of adjusted EBITDA is intended to be consistent with the calculation of that measure as required by the Company’s borrowing arrangements, and used to calculate a leverage ratio (maximum of 4.50 at April 2, 2022) and an interest coverage ratio (minimum of 3.00 for the twelve months ended April 2, 2022).
For the three and six months ended April 2, 2022 , the following items were adjusted, in accordance with the definitions above, to arrive at the non-GAAP financial measures:
- During the second quarter of fiscal 2022, the Company announced plans to consolidate U.S. lighting manufacturing for its Hawthorne segment into a single location and to close another recently acquired assembly facility and move those operations to its Santa Rosa, California facility. During the three and six months ended April 2, 2022, the Company incurred costs of $5.3 million in the “Cost of sales—impairment, restructuring and other” line in the Condensed Consolidated Statements of Operations and $0.1 million in the “Impairment, restructuring and other” line in the Condensed Consolidated Statements of Operations related to employee termination benefits and impairment of property, plant and equipment associated with this restructuring initiative.
For the three and six months ended April 3, 2021, the following items were adjusted, in accordance with the definitions above, to arrive at the non-GAAP financial measures:
- During the three and six months ended April 3, 2021, the Company incurred costs of $12.3 million and $21.0 million, respectively, in the “Cost of sales—impairment, restructuring and other” line in the Condensed Consolidated Statements of Operations and incurred costs of $2.6 million and $3.2 million, respectively, in the “Impairment, restructuring and other” line in the Condensed Consolidated Statements of Operations associated with the COVID-19 pandemic primarily related to premium pay.
- On December 31, 2020, pursuant to the terms of the Contribution and Unit Purchase Agreement between the Company and Alabama Farmers Cooperative, Inc. (“AFC”), the Company acquired a 50% equity interest in the Bonnie Plants business through a newly formed joint venture with AFC (“Bonnie Plants, LLC”) in exchange for a cash payment of $100.7 million, forgiveness of the Company’s outstanding loan receivable with AFC and termination of the Company’s options to increase its economic interest in the Bonnie Plants business. The Company’s loan receivable with AFC, which was previously recognized in the “Other assets” line in the Condensed Consolidated Balance Sheets, had a carrying value of $66.4 million on December 31, 2020 and the Company recognized a gain of $12.5 million during the first quarter of fiscal 2021 to write-up the value of the loan to its closing date fair value in the “Other non-operating income, net” line in the Condensed Consolidated Statements of Operations. The Company’s interest in Bonnie Plants, LLC had an initial fair value of $202.9 million and is recorded in the “Investment in unconsolidated affiliates” line in the Condensed Consolidated Balance Sheets. The Company’s interest is accounted for using the equity method of accounting, with the Company’s proportionate share of Bonnie Plants, LLC earnings subsequent to December 31, 2020 reflected in the Condensed Consolidated Statements of Operations.