![]()
ScottsMiracle-Gro Announces Third Quarter Financial Results; Introduces Project Springboard to Enhance Shareholder Value
Company reduces full-year sales and earnings outlook
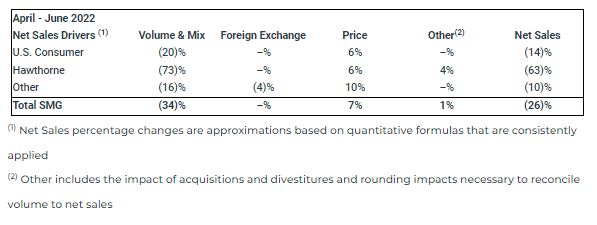
- Company-wide third quarter sales decreased 26% driven by Hawthorne decline of 63% and U.S. Consumer decline of 14%
- Consumer POS climbed in May & June; year-to-date POS dollars down 5%
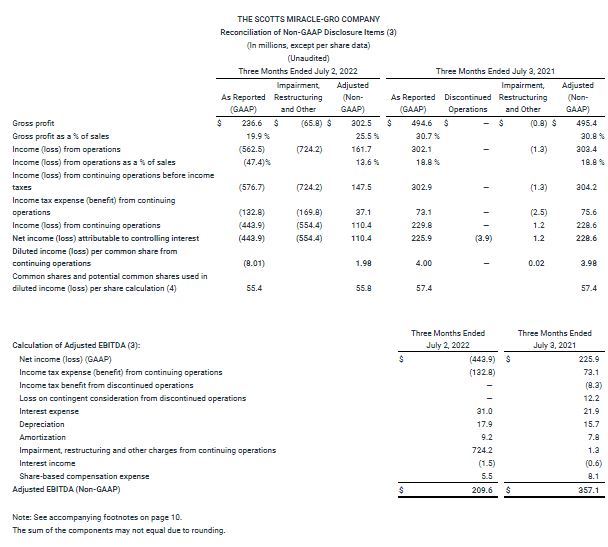
- Q3 GAAP EPS loss of $8.01 per share, includes pre-tax impairment and restructuring charges of $724 million; non-GAAP adjusted EPS of $1.98
- Company announces Project Springboard to strengthen the balance sheet, expand margins and improve free cash flow
- Management lowered its full-year sales guidance for U.S. Consumer to down 8 to 9 percent and full-year EPS to $4.00 to $4.20
MARYSVILLE, Ohio, Aug. 03, 2022 (GLOBE NEWSWIRE) — The Scotts Miracle-Gro Company (NYSE: SMG), the world’s leading marketer of branded consumer lawn and garden as well as indoor and hydroponic growing products, today announced its results for the third quarter ended July 2, 2022.
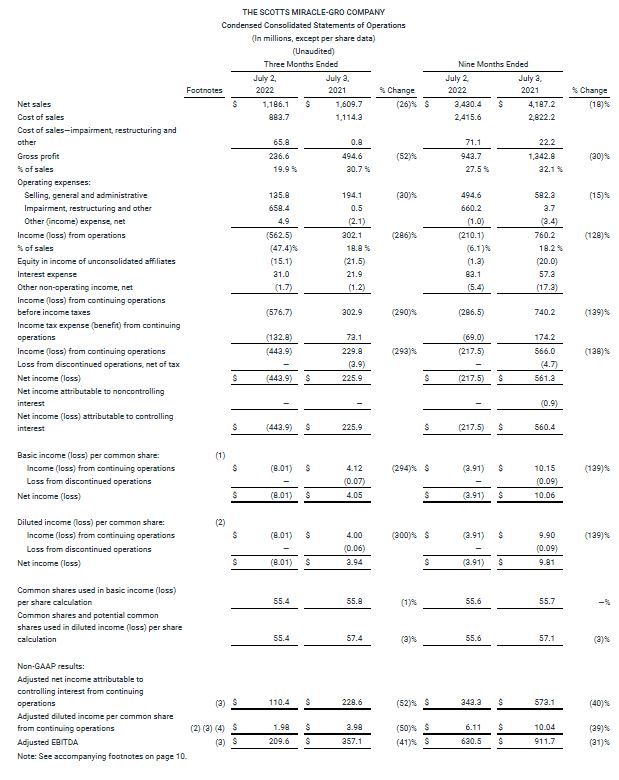
Sales for the period declined by 26 percent reflecting decreases in both major business segments. The Company reported a GAAP net loss per share of $8.01, which includes pre-tax impairment and restructuring charges of $724.2 million. Non-GAAP adjusted earnings per share, which is the basis of the Company’s guidance, was $1.98.
Separately, the Company announced Project Springboard, a cross-functional initiative to expand margins, improve cash flow and strengthen the balance sheet to provide a solid foundation for sustainable shareholder value creation.
Behind a complicated story this quarter, we were pleased to see consumer engagement build as the weather improved and the season progressed. While consumer purchases are down 8 percent in units year-to-date, that performance is in line with the guidance we laid out at the beginning of the year.
 Jim Hagedorn, chairman and chief executive officer.
We are extremely encouraged that consumer purchases in May and June were at near-record levels, once again showing the resiliency of the category. Unfortunately, shipments to our retailer partners did not keep pace with consumer demand, as retailers in all channels took steps to lower their own inventory levels.
“The lower-than-expected sales in our U.S. Consumer segment, combined with continued pressure on Hawthorne sales due to oversupply issues in the cannabis industry, leave us unsatisfied with our financial results and with higher leverage than we want to maintain. That is why we have launched the business transformation effort we are calling Project Springboard, which includes a series of aggressive steps to return the business to an appropriate level of performance.
“The outcome of Project Springboard will lead to a set of detailed financial and incentive-related targets to ensure we are making substantive progress and holding ourselves accountable. We are committed to getting the business back on the right track, returning to an appropriate level of profitability in both segments.”
Third quarter details
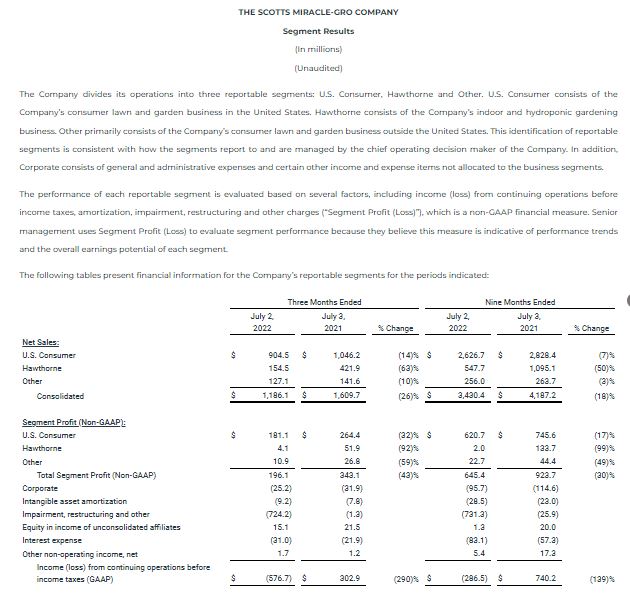
For the quarter ended July 2, 2022, company-wide sales decreased 26 percent to $1.19 billion. U.S. Consumer segment sales declined 14 percent to $904.5 million from $1.05 billion. Hawthorne segment sales decreased 63 percent to $154.5 million compared with $421.9 million during the same period last year.
GAAP and non-GAAP adjusted gross margin rates for the quarter were 19.9 percent and 25.5 percent, respectively. These compare to 30.7 percent and 30.8 percent, respectively, in the prior year. The declines were due primarily to unfavorable fixed cost leverage related to volume. Higher commodity costs and unfavorable distribution costs also negatively impacted gross margins in the quarter. Those pressures were partially offset by price increases and favorable segment mix due to the decline in the lower-margin Hawthorne segment.
SG&A decreased 30 percent to $135.8 million due to lower accruals for annual incentive compensation and cost-reduction efforts.
Interest expense increased $9.1 million on a year-over-year basis to $31.0 million, driven by an increase in average borrowings. The Company’s debt-to-EBITDA ratio at the end of the quarter was 5.1 times.
“The recent amendment to our credit facility provides flexibility for leverage up to 6.5 times debt-to-EBITDA at our expected peak, but, clearly, we are taking aggressive steps to reduce leverage as quickly as possible,” said Cory Miller, executive vice president and chief financial officer. “We are committed to getting leverage back to our target of 3.5 times debt-to-EBITDA within 24 months. We intend to provide more details around these efforts in early November when we announce year-end earnings and discuss our initial outlook for fiscal 2023.”
GAAP loss from continuing operations was $443.9 million, or $8.01 per share, compared with prior year income of $229.8 million, or $4.00 per share. Those results include non-cash, pre-tax impairment charges of $632.4 million related to goodwill and certain intangible assets of the Hawthorne segment, as well as related inventory write-down charges of $45.9 million. It also includes restructuring charges of $40.7 million related to recent organizational changes. The Company anticipates additional restructuring charges related to network and organizational changes in the coming quarters. Non-GAAP adjusted earnings, which exclude impairment, restructuring, and other non-recurring items, were $110.4 million, or $1.98 per diluted share, compared with $228.6 million, or $3.98 per diluted share last year.
Year-to-date details
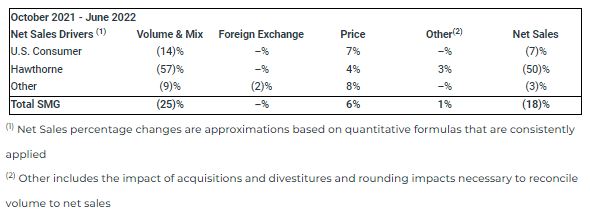
Company-wide sales for the first nine months of fiscal 2022 decreased 18 percent to $3.43 billion compared with $4.19 billion a year ago. Sales in the U.S. Consumer segment decreased 7 percent, to $2.63 billion. Hawthorne sales decreased 50 percent to $547.7 million.
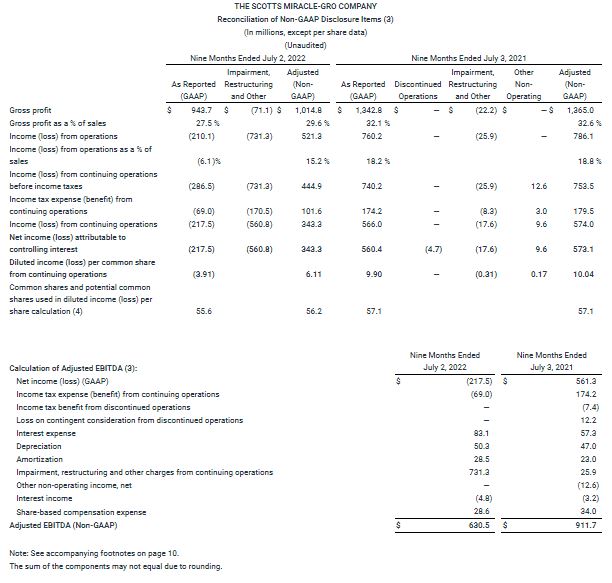
The GAAP gross margin rate on a year-to-date basis was 27.5 percent. The non-GAAP adjusted rate was 29.6 percent. These compare with 32.1 percent and 32.6 percent, respectively, last year. The reasons for the year-to-date decline are consistent with the factors that drove third quarter results.
SG&A was $494.6 million, a 15 percent decrease from 2021, driven by lower accruals for annual incentive compensation and cost-reduction efforts.
Interest expense increased $25.8 million to $83.1 million due to an increase in average borrowings.
GAAP loss from continuing operations was $217.5 million, or $3.91 per share, compared with income of $566.0 million, or $9.90 per share, in the prior year. Non-GAAP adjusted earnings, which exclude impairment, restructuring and other non-recurring items, were $343.3 million, or $6.11 per diluted share, compared with $573.1 million, or $10.04 per diluted share last year.
Full-year outlook
The Company lowered its full-year sales guidance in the U.S. Consumer segment due to lower-than-expected replenishment orders from retail partners. The Company now expects sales to decline 8 to 9 percent. The Company also expects further SG&A favorability and is now guiding full-year SG&A down 15 percent. As a result of these changes, the full-year adjusted EPS outlook is now expected to be $4.00 to $4.20.
“Our guidance in early June accounted for the reduction in May replenishment orders that we saw at our largest customers,” Miller said. “However, retail inventory reduction efforts have accelerated throughout June and July, driving a larger decline in our full-year sales expectation. The outlook for SG&A has improved from the previous guidance we communicated in June. The Project Springboard team achieved the initial cost savings target and identified additional opportunities to reduce spending across the business.”
Conference Call and Webcast Scheduled for 9 a.m. ET Today, August 3
The Company will discuss results during a webcast and conference call today at 9:00 a.m. ET. To participate in the conference call, please call 1-888-220-8451 (Confirmation Code: 2366358). A replay of the call can be heard by calling 1-888-203-1112. The replay will be available for 15 days. A live webcast of the call and the press release will be available on the Company’s investor relations website at http://investor.scotts.com. An archive of the press release and any accompanying information will remain available for at least a 12-month period.
About ScottsMiracle-Gro
With approximately $4.9 billion in sales, the Company is one of the world’s largest marketers of branded consumer products for lawn and garden care. The Company’s brands are among the most recognized in the industry. The Company’s Scotts®, Miracle-Gro® and Ortho® brands are market-leading in their categories. The Company’s wholly-owned subsidiary, The Hawthorne Gardening Company, is a leading provider of nutrients, lighting and other materials used in the indoor and hydroponic growing segment. For additional information, visit us at www.scottsmiraclegro.com.
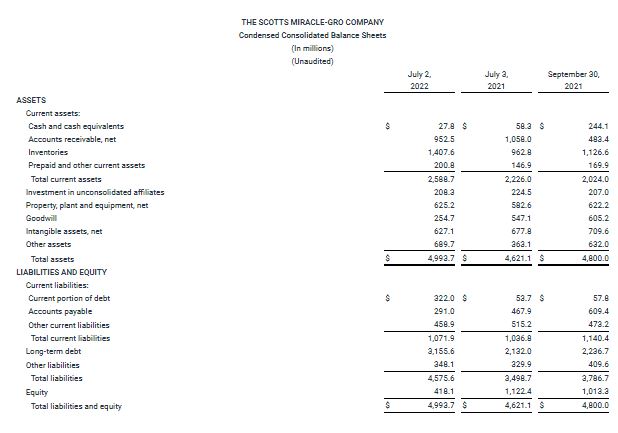
THE SCOTTS MIRACLE-GRO COMPANY
Footnotes to Preceding Financial Statements
(1) Basic income (loss) per common share amounts are calculated by dividing income (loss) attributable to controlling interest from continuing operations, income (loss) from discontinued operations and net income (loss) attributable to controlling interest by the weighted average number of common shares outstanding during the period.
(2) Diluted income (loss) per common share amounts are calculated by dividing income (loss) attributable to controlling interest from continuing operations, income (loss) from discontinued operations and net income (loss) attributable to controlling interest by the weighted average number of common shares, plus all potential dilutive securities (common stock options, performance shares, performance units, restricted stock and restricted stock units) outstanding during the period.
(3) Reconciliation of Non-GAAP Measures
Use of Non-GAAP Measures
To supplement the financial measures prepared in accordance with U.S. generally accepted accounting principles (“GAAP”), the Company uses non-GAAP financial measures. The reconciliations of these non-GAAP financial measures to the most directly comparable financial measures calculated and presented in accordance with GAAP are shown in the tables above. These non-GAAP financial measures should not be considered in isolation from, or as a substitute for or superior to, financial measures reported in accordance with GAAP. Moreover, these non-GAAP financial measures have limitations in that they do not reflect all the items associated with the operations of the business as determined in accordance with GAAP. Other companies may calculate similarly titled non-GAAP financial measures differently than the Company, limiting the usefulness of those measures for comparative purposes.
In addition to GAAP measures, management uses these non-GAAP financial measures to evaluate the Company’s performance, engage in financial and operational planning and determine incentive compensation because it believes that these measures provide additional perspective on and, in some circumstances are more closely correlated to, the performance of the Company’s underlying, ongoing business.
Management believes that these non-GAAP financial measures are useful to investors in their assessment of operating performance and the valuation of the Company. In addition, these non-GAAP financial measures address questions routinely received from analysts and investors and, in order to ensure that all investors have access to the same data, management has determined that it is appropriate to make this data available to all investors. Non-GAAP financial measures exclude the impact of certain items (as further described below) and provide supplemental information regarding operating performance. By disclosing these non-GAAP financial measures, management intends to provide investors with a supplemental comparison of operating results and trends for the periods presented. Management believes these non-GAAP financial measures are also useful to investors as such measures allow investors to evaluate performance using the same metrics that management uses to evaluate past performance and prospects for future performance. Management views free cash flow as an important measure because it is one factor used in determining the amount of cash available for dividends and discretionary investment.
Exclusions from Non-GAAP Financial Measures
Non-GAAP financial measures reflect adjustments based on the following items:
- Impairments, which are excluded because they do not occur in or reflect the ordinary course of the Company’s ongoing business operations and their exclusion results in a metric that provides supplemental information about the sustainability of operating performance.
- Restructuring and employee severance costs, which include charges for discrete projects or transactions that fundamentally change the Company’s operations and are excluded because they are not part of the ongoing operations of its underlying business, which includes normal levels of reinvestment in the business.
- Costs related to refinancing, which are excluded because they do not typically occur in the normal course of business and may obscure analysis of trends and financial performance. Additionally, the amount and frequency of these types of charges is not consistent and is significantly impacted by the timing and size of debt financing transactions.
- Discontinued operations and other unusual items, which include costs or gains related to discrete projects or transactions and are excluded because they are not comparable from one period to the next and are not part of the ongoing operations of the Company’s underlying business.
The tax effect for each of the items listed above is determined using the tax rate and other tax attributes applicable to the item and the jurisdiction(s) in which the item is recorded.
Definitions of Non-GAAP Financial Measures
The reconciliations of non-GAAP disclosure items include the following financial measures that are not calculated in accordance with GAAP and are utilized by management in evaluating the performance of the business, engaging in financial and operational planning, determining incentive compensation and determining the amount of cash available for dividends and discretionary investments, and by investors and analysts in evaluating performance of the business:
Adjusted gross profit: Gross profit excluding impairment, restructuring and other charges / recoveries.
Adjusted income (loss) from operations: Income (loss) from operations excluding impairment, restructuring and other charges / recoveries.
Adjusted income (loss) from continuing operations before income taxes: Income (loss) from continuing operations before income taxes excluding impairment, restructuring and other charges / recoveries, costs related to refinancing and certain other non-operating income / expense items.
Adjusted income tax expense (benefit) from continuing operations: Income tax expense (benefit) from continuing operations excluding the tax effect of impairment, restructuring and other charges / recoveries, costs related to refinancing and certain other non-operating income / expense items.
Adjusted income (loss) from continuing operations: Income (loss) from continuing operations excluding impairment, restructuring and other charges / recoveries, costs related to refinancing and certain other non-operating income / expense items, each net of tax.
Adjusted net income (loss) attributable to controlling interest from continuing operations: Net income (loss) attributable to controlling interest excluding impairment, restructuring and other charges / recoveries, costs related to refinancing, certain other non-operating income / expense items and discontinued operations, each net of tax.
Adjusted diluted income (loss) per common share from continuing operations: Diluted net income (loss) per common share from continuing operations excluding impairment, restructuring and other charges / recoveries, costs related to refinancing and certain other non-operating income / expense items, each net of tax.
Adjusted EBITDA: Net income (loss) before interest, taxes, depreciation and amortization as well as certain other items such as the impact of the cumulative effect of changes in accounting, costs associated with debt refinancing and other non-recurring or non-cash items affecting net income (loss). The presentation of adjusted EBITDA is intended to be consistent with the calculation of that measure as required by the Company’s borrowing arrangements, and used to calculate a leverage ratio (maximum of 6.25 at July 2, 2022) and an interest coverage ratio (minimum of 3.00 for the twelve months ended July 2, 2022).
For the three and nine months ended July 2, 2022 , the following items were adjusted, in accordance with the definitions above, to arrive at the non-GAAP financial measures:
- During the three and nine months ended July 2, 2022, the Company recognized non-cash, pre-tax goodwill and intangible asset impairment charges of $632.4 million related to its Hawthorne segment in the “Impairment, restructuring and other” line in the Condensed Consolidated Statements of Operations, comprised of $522.4 million of goodwill impairment charges and $110.0 million of finite-lived intangible asset impairment charges. The tax impact of the impairment charges was a benefit of $138.0 million for the three and nine months ended July 2, 2022 and was recorded in the “Income tax expense (benefit) from continuing operations” line in the Condensed Consolidated Statements of Operations.
- During the three and nine months ended July 2, 2022, the Company incurred inventory write-down charges of $45.9 million in the “Cost of sales—impairment, restructuring and other” line in the Condensed Consolidated Statements of Operations associated with its decision to discontinue and exit the market for certain lighting products and brands.
- During the three and nine months ended July 2, 2022, the Company began implementing an expanded series of organizational changes and initiatives intended to create operational and management-level efficiencies. As part of this restructuring program, the Company is reducing the size of its supply chain network, reducing staffing levels and implementing other cost-reduction initiatives. During the three and nine months ended July 2, 2022, the Company incurred costs of $19.9 million and $25.2 million, respectively, in the “Cost of sales—impairment, restructuring and other” line in the Condensed Consolidated Statements of Operations and $20.8 million in the “Impairment, restructuring and other” line in the Condensed Consolidated Statements of Operations primarily related to employee termination benefits and impairment of property, plant and equipment associated with this restructuring initiative.
For the three and nine months ended July 3, 2021, the following items were adjusted, in accordance with the definitions above, to arrive at the non-GAAP financial measures:
- During the three and nine months ended July 3, 2021, the Company incurred costs of $1.5 million and $22.5 million, respectively, in the “Cost of sales—impairment, restructuring and other” line in the Condensed Consolidated Statements of Operations and incurred costs of $0.4 million and $3.6 million, respectively, in the “Impairment, restructuring and other” line in the Condensed Consolidated Statements of Operations associated with the COVID-19 pandemic primarily related to premium pay.
- On December 31, 2020, pursuant to the terms of the Contribution and Unit Purchase Agreement between the Company and Alabama Farmers Cooperative, Inc. (“AFC”), the Company acquired a 50% equity interest in the Bonnie Plants business through a newly formed joint venture with AFC (“Bonnie Plants, LLC”) in exchange for cash payments of $102.3 million, forgiveness of the Company’s outstanding loan receivable with AFC and termination of the Company’s options to increase its economic interest in the Bonnie Plants business. The Company’s loan receivable with AFC, which was previously recognized in the “Other assets” line in the Condensed Consolidated Balance Sheets, had a carrying value of $66.4 million on December 31, 2020 and the Company recognized a gain of $12.5 million during the first quarter of fiscal 2021 to write-up the value of the loan to its closing date fair value in the “Other non-operating income, net” line in the Condensed Consolidated Statements of Operations. The Company’s interest in Bonnie Plants, LLC had an initial fair value of $202.9 million and is recorded in the “Investment in unconsolidated affiliates” line in the Condensed Consolidated Balance Sheets. The Company’s interest is accounted for using the equity method of accounting, with the Company’s proportionate share of Bonnie Plants, LLC earnings subsequent to December 31, 2020 reflected in the Condensed Consolidated Statements of Operations.
(4) Diluted average common shares used in the GAAP diluted loss per common share from continuing operations calculation for the three and nine months ended July 2, 2022 excluded dilutive potential Common Shares of 0.4 million and 0.6 million, respectively, because the effect of their inclusion would be anti-dilutive as the Company incurred a net loss for the three and nine months ended July 2, 2022. Diluted average common shares used in the non-GAAP adjusted diluted income per common share from continuing operations calculation for the three and nine months ended July 2, 2022 included dilutive potential Common Shares of 0.4 million and 0.6 million, respectively.