![]()
Turning Point Brands Announces Fourth Quarter and Full Year 2022 Results
-Net Sales for FY 2022 Zig-Zag and Stoker’s Products Increased 6.8 Percent Year-Over-Year
LOUISVILLE, Ky.- February 24, 2023-(BUSINESS WIRE)–Turning Point Brands, Inc. (“TPB” or “the Company”) (NYSE: TPB), a manufacturer, marketer and distributor of branded consumer products, including alternative smoking accessories and consumables with active ingredients, announced today financial results for the fourth quarter and full year ended December 31, 2022.
Q4 2022 vs. Q4 2021
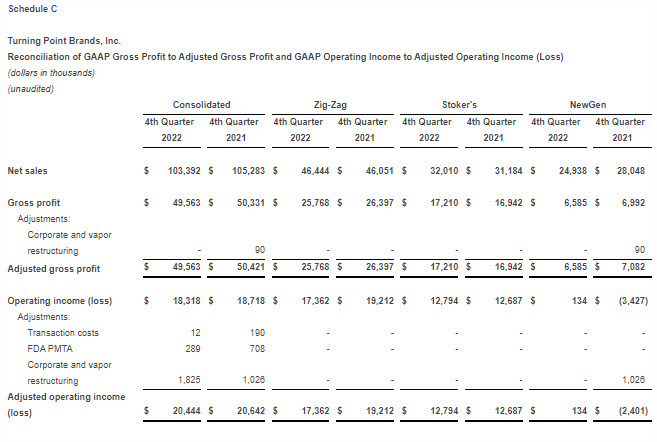
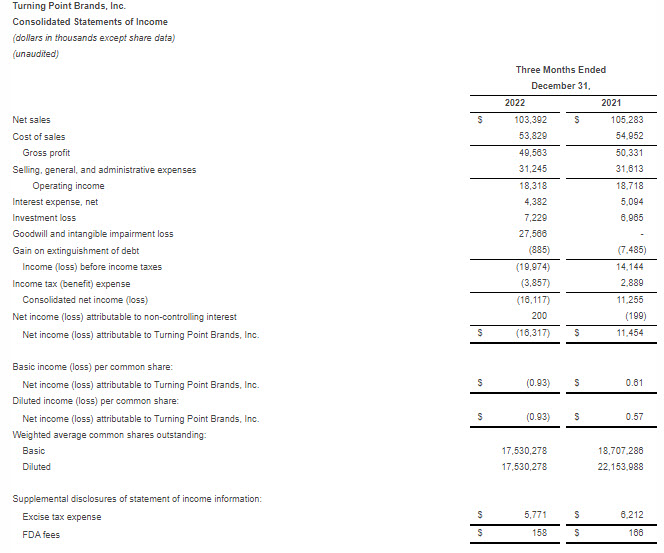
- Total consolidated net sales decreased 1.8% to $103.4 million
- Combined net sales for Zig-Zag and Stoker’s Products increased 1.6% (increased 0.9% and 2.6%, respectively)
- NewGen net sales declined by 11.1%
- Gross profit decreased 1.5% to $49.6 million
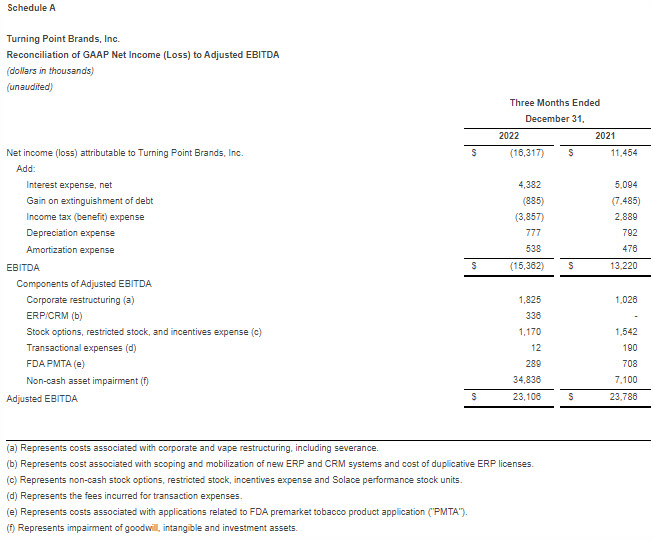
- Net income decreased $27.8 million to $($16.3) million primarily due to $34.8 million non-cash asset impairments
- Adjusted net income decreased $0.2 million to $13.2 million
- Adjusted EBITDA decreased 2.9% to $23.1 million (see Schedule A for a reconciliation to net income)
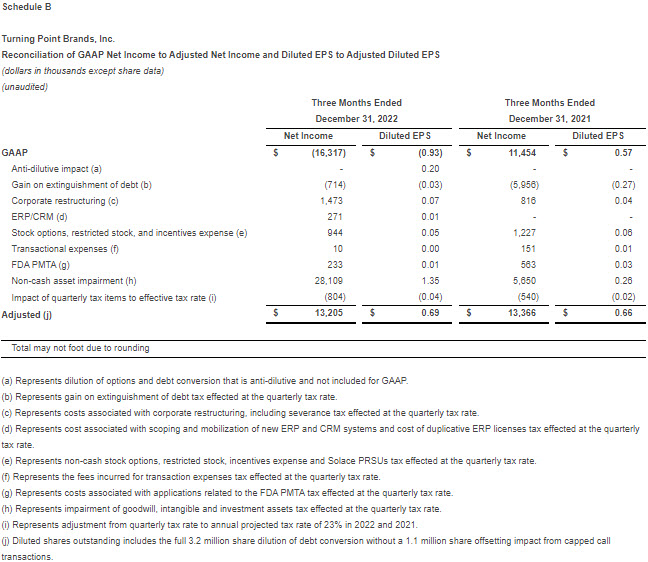
- Diluted EPS of $(0.93) and Adjusted Diluted EPS of $0.69 compared to $0.57 and $0.66 in the same period one year ago, respectively (see Schedule B for a reconciliation to Diluted EPS)
FY 2022 vs. FY 2021
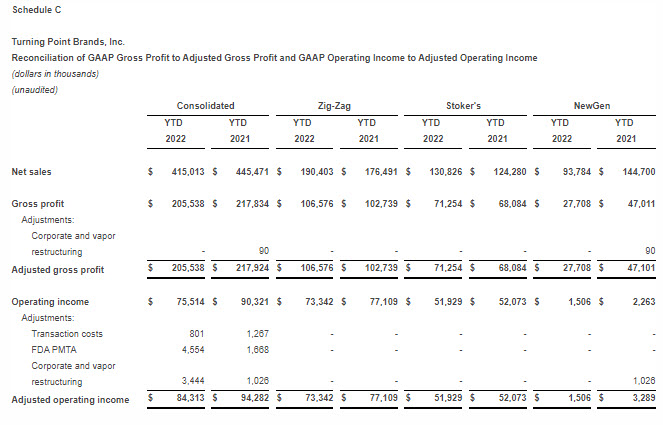
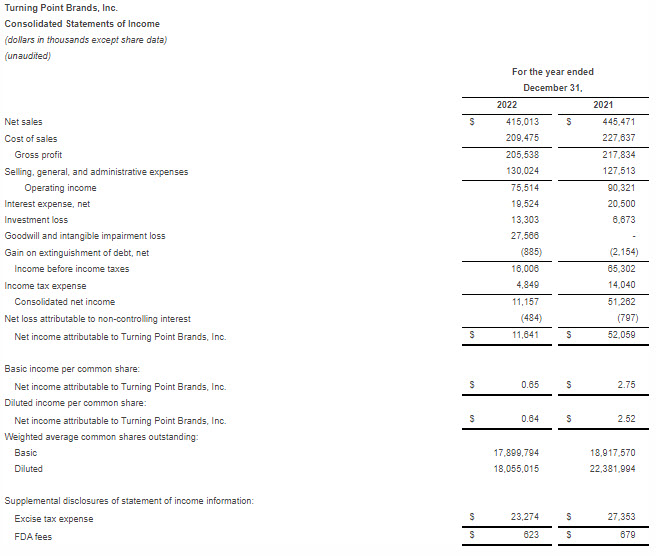
- Total consolidated net sales decreased 6.8% to $415.0 million
- Combined net sales for Zig-Zag and Stoker’s Products increased 6.8% (increased 7.9% and 5.3%, respectively)
- NewGen net sales declined by 35.2%
- Gross profit decreased 5.6% to $205.5 million
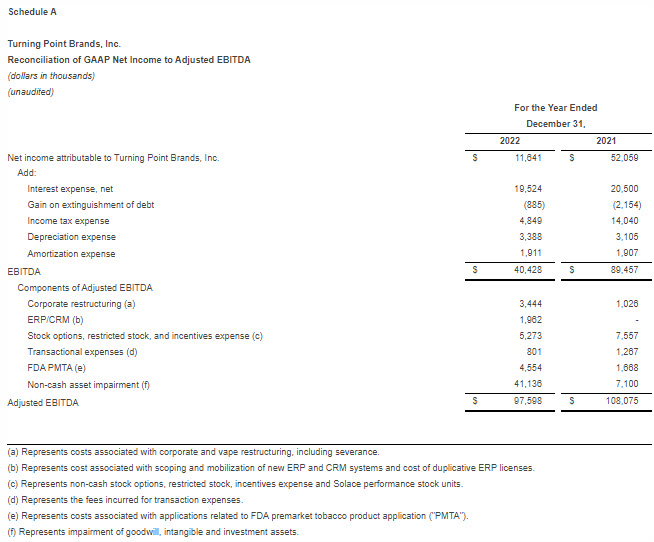
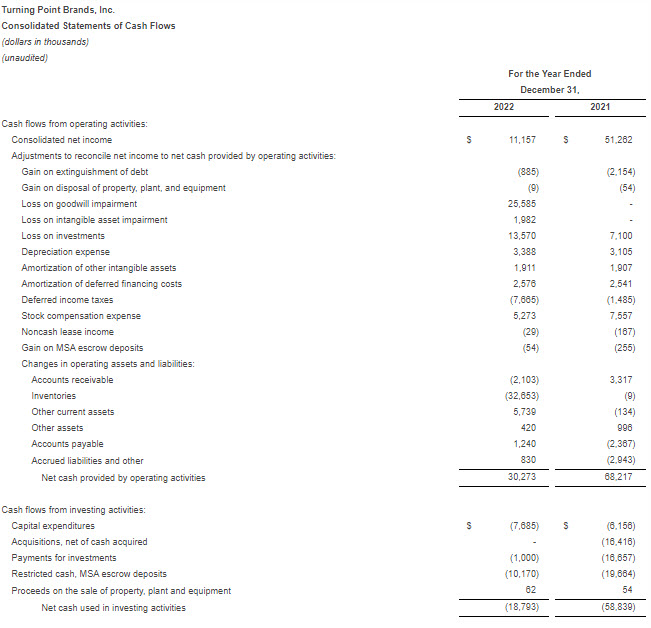
- Net income decreased $40.4 million to $11.6 million due in part to $41.1 million non-cash asset impairments
- Adjusted net income decreased $7.4 million to $56.2 million
- Adjusted EBITDA decreased 9.7% to $97.6 million (see Schedule A for a reconciliation to net income)
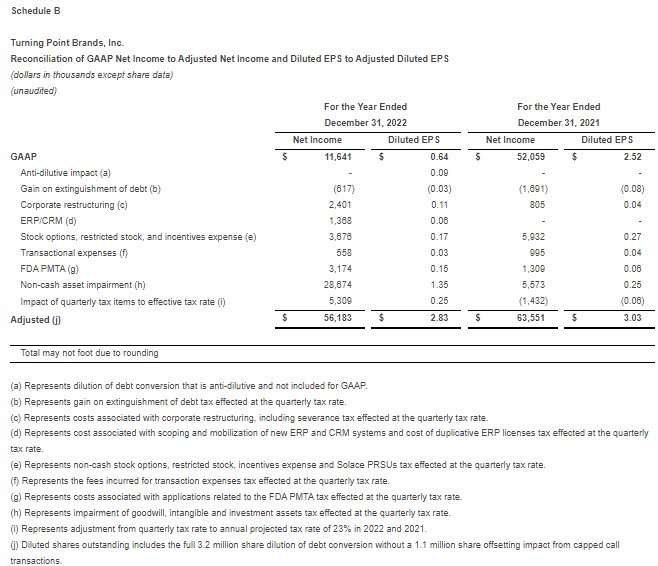
- Diluted EPS of $0.64 and Adjusted Diluted EPS of $2.83 as compared to $2.52 and $3.03 in the same period one year ago, respectively (see Schedule B for a reconciliation to Diluted EPS)
The fourth quarter operating results finished in-line with our expectations with solid execution across our segments. The Zig-Zag segment grew during the quarter despite the impact of a previously disclosed pull-forward in the prior quarter, benefitting from continued market share gains and the contribution from a full quarter of CLIPPER lighters.
 Graham Purdy, President and CEO
“We are pleased with the ongoing roll-out and strong channel receptivity to the world’s #1 reusable lighter. Stoker’s MST experienced strong share gains as consumer trade-downs to value accelerated, consistent with the current inflationary and economic backdrop. The challenging regulatory environment continues to negatively affect the NewGen segment which was down materially vs. 2021, but with declines moderating in the back half of the year. In addition to returning capital to our shareholders through share repurchases, we opportunistically purchased $10 million notional of our convertible notes during the fourth quarter while maintaining a strong cash balance. Over the last few months since taking on the CEO role, my primary objective has been to re-direct our focus and energy towards driving organic long-term growth. This starts with allocating resources to products, initiatives, and channels best positioned towards this goal. Our organization is now better aligned towards capitalizing on the opportunities in front of us and we look forward to delivering against our long-term plans going forward.”
Zig-Zag Products Segment (45% of total net sales in the quarter)
For the fourth quarter, Zig-Zag Products net sales increased 0.9% to $46.4 million. Both of TPB’s Canadian and other smoking accessories businesses saw strong growth during the quarter. This was partially offset by anticipated declines in the U.S. rolling papers and wraps businesses which were impacted by the previously disclosed pull-forward of sales into the prior quarter due to the timing of promotional programs. For the fourth quarter, total Zig-Zag Products segment volume increased 0.8%, while price / mix increased 0.1%.
For the quarter, the Zig-Zag Products segment gross profit decreased 2.4% to $25.8 million. Gross margin declined 180 basis points to 55.5% driven primarily by product mix including the ramp of our CLIPPER lighters business which operates at lower gross profit margins.
For the full year, net sales of Zig-Zag Products increased 7.9% to $190.4 million with double-digit advances in the U.S. rolling papers and e-commerce, other smoking accessories, and Canadian businesses partially offset by a double-digit decline in the wraps business. For the full year, total Zig-Zag Products segment volume increased 6.4%, while price / mix increased 1.5%.
For the full year, Zig-Zag Products segment gross profit increased 3.7% to $106.6 million. Gross margin contracted 220 basis points to 56.0%, driven primarily by product mix including the launch of our CLIPPER lighters business which operates at lower gross profit margins.
“Zig-Zag papers demonstrated solid share growth for the year while we continue to build our presence in the alternative channel,” said Purdy. “Furthermore, we remain excited about our continued roll-out of CLIPPER lighters in the U.S. and Canada.”
Stoker’s Products Segment (31% of total net sales in the quarter)
For the fourth quarter, Stoker’s Products net sales increased 2.6% to $32.0 million on double-digit growth of MST partially offset by a double-digit decline in loose-leaf chewing tobacco. For the fourth quarter, total Stoker’s Products segment volume decreased 6.1%, while price / mix increased 8.7%.
For the quarter, the Stoker’s Products segment gross profit increased 1.6% to $17.2 million. Gross margin contracted 50 basis points to 53.8% due to product mix shift.
For the full year, net sales of Stoker’s Products increased 5.3% to $130.8 million on double-digit growth of MST partially offset by a high single-digit decline of loose-leaf chewing tobacco. For the full year, total Stoker’s Products segment volume decreased 2.6%, while price / mix increased 7.9%.
For the full year, the Stoker’s Products segment gross profit increased 4.7% to $71.3 million. Gross margin contracted 30 basis points to 54.5% due to the impact of product mix shift including growth in discount looseleaf products.
“Stoker’s saw strong market share gains in both the MST and loose-leaf chewing tobacco categories during the quarter,” continued Purdy. “Stoker’s strong value proposition continues to resonate with consumers in the current inflationary environment that has challenged their budgets.”
NewGen Products Segment (24% of total net sales in the quarter)
For the fourth quarter, NewGen Products net sales decreased 11.1% to $24.9 million. The regulatory environment continues to negatively impact sales.
For the quarter, NewGen Products segment gross profit decreased 5.8% to $6.6 million. Gross margin increased 150 basis points from the previous year to 26.4% primarily due to higher inventory write-downs in the previous year period.
For the full year, net sales of NewGen Products decreased 35.2% to $93.8 million and gross profit decreased 41.1% to $27.7 million. Gross margin contracted 300 basis points to 29.5% due to product mix and the highly promotional environment.
“The regulatory environment for NewGen remains dynamic given the uncertainty over the outcome of the PMTA process and the potential for additional state and federal regulations,” concluded Purdy.
Recent Events
Creative Distribution Solutions
On December 21, 2022, Turning Point Brands contributed its NewGen Products business to South Beach Holdings LLC doing business as Creative Distribution Solutions (“CDS”), a newly-formed wholly-owned subsidiary. CDS specializes in the distribution of vapor and related products to B2B and B2C customers throughout the United States. CDS will be overseen by an independent board of management. “We believe this reorganization best positions CDS to navigate the current regulatory environment, adapt to future marketplace changes, and pursue further value maximizing opportunities as they arise,” noted Mr. Purdy.
Performance Measures in the Fourth Quarter
Fourth quarter consolidated selling, general and administrative (“SG&A”) expenses were $31.2 million compared to $31.6 million in the fourth quarter of 2021.
The fourth quarter SG&A included the following notable items:
- $0.3 million of ERP / CRM duplicative system costs compared to none in the previous year
- $1.2 million of stock options, restricted stock and incentive expense compared to $1.5 million in the year-ago period
- $0.3 million of FDA PMTA-related expenses compared to $0.7 million in the year-ago period
- $0.0 million of transaction expenses as compared to $0.2 million in the year-ago period
- $1.8 million of restructuring costs as compared to $0.9 million in the year-ago period
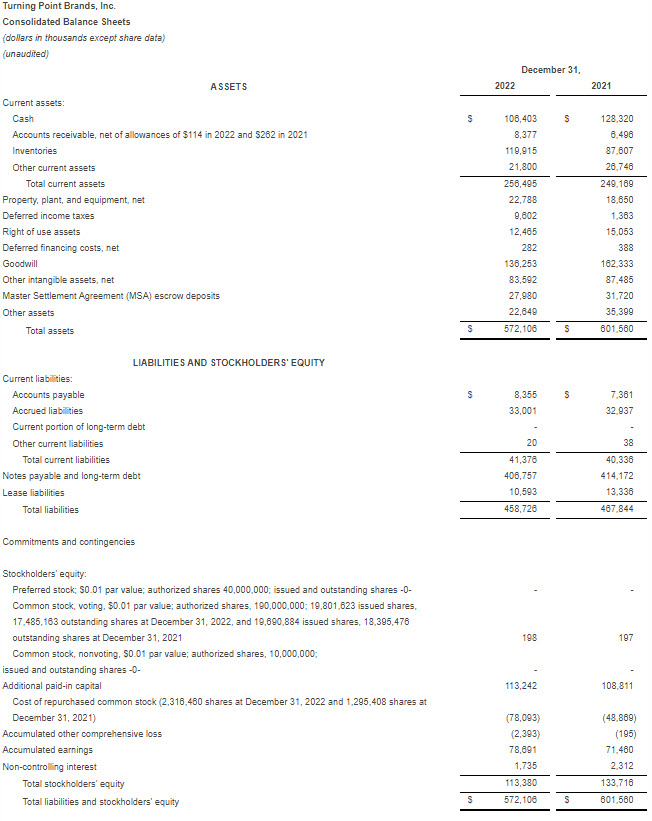
Total gross debt as of December 31, 2022 was $412.5 million. The corresponding net debt (total gross debt less cash) at December 31, 2022 was $306.1 million. The Company ended the quarter with total liquidity of $127.8 million, comprised of $106.4 million in cash and $21.4 million of revolving credit facility capacity.
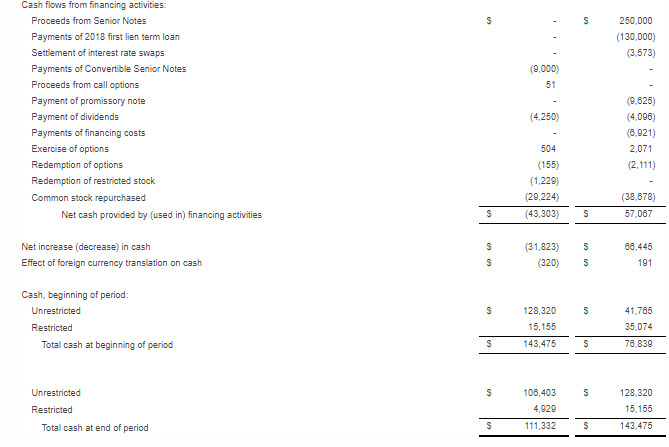
During the quarter, the Company spent $2.2 million to repurchase 101,959 shares at an average price of $21.50 per share. During the quarter, the Company also spent $9.0 million to purchase $10.0 million in aggregate principal amount of its 2.50% Convertible Senior Notes due July 2024.
The Company recorded impairment charges of $34.8 million during the quarter related to goodwill and intangible assets of the NewGen segment and certain minority investments in development stage ventures.
2023 Outlook
At this time, the Company expects full-year 2023 adjusted EBITDA to be $88 to $94 million.
Earnings Conference Call
As previously disclosed, a conference call with the investment community to review TPB’s financial results has been scheduled for 10:00 a.m. Eastern on Friday, February 24, 2023. Investment community participants should dial in 10 minutes ahead of time using the toll-free number 888-330-2502 (international participants should call 240-789-2713), and follow the audio prompts after typing in the event ID: 6640134. A live listen-only webcast of the call will be available on the Events and Presentations section of the investor relations portion of the Company website (www.turningpointbrands.com). A replay of the webcast will be available on the site two hours following the call.
Non-GAAP Financial Measures
In addition to financial measures prepared in accordance with generally accepted accounting principles in the United States (GAAP), this press release includes certain non-GAAP financial measures including EBITDA, Adjusted EBITDA, Adjusted Net Income, Adjusted Diluted EPS and Adjusted Operating Income (Loss). A reconciliation of these non-GAAP financial measures accompanies this release.
About Turning Point Brands, Inc.
Turning Point Brands (NYSE: TPB) is a manufacturer, marketer and distributor of branded consumer products including alternative smoking accessories and consumables with active ingredients through its iconic Zig-Zag® and Stoker’s® brands, and its emerging brands within the NewGen segment. TPB’s products are available in more than 215,000 retail outlets in North America, and on sites such as www.zigzag.com and www.solacevapor.com. For the latest news and information about TPB and its brands, please visit www.turningpointbrands.com.
Non-GAAP Financial Measures
To supplement our financial information presented in accordance with generally accepted accounting principles in the United States, or U.S. GAAP, we use non-U.S. GAAP financial measures, including EBITDA, Adjusted EBITDA, Adjusted Net Income, Adjusted Diluted EPS, Adjusted Gross Profit and Adjusted Operating Income (Loss). We believe Adjusted EBITDA provides useful information to management and investors regarding certain financial and business trends relating to our financial condition and results of operations. Adjusted EBITDA, Adjusted Net Income, Adjusted Diluted EPS, Adjusted Gross Profit and Adjusted Operating Income (Loss) are used by management to compare our performance to that of prior periods for trend analyses and planning purposes and are presented to our board of directors. We believe that EBITDA, Adjusted EBITDA, Adjusted Net Income, Adjusted Diluted EPS, Adjusted Gross Profit and Adjusted Operating Income (Loss) are appropriate measures of operating performance because they eliminate the impact of expenses that do not relate to business performance.
We define “EBITDA” as net income before interest expense, loss on extinguishment of debt, provision for income taxes, depreciation and amortization. We define “Adjusted EBITDA” as net income before interest expense, loss on extinguishment of debt, provision for income taxes, depreciation, amortization, other non-cash items and other items that we do not consider ordinary course in our evaluation of ongoing operating performance. We define “Adjusted Net Income” as net income excluding items that we do not consider ordinary course in our evaluation of ongoing operating performance. We define “Adjusted Diluted EPS” as diluted earnings per share excluding items that we do not consider ordinary course in our evaluation of ongoing operating performance. We define “Adjusted Gross Profit: as gross profit excluding other non-cash items and other items that we do not consider ordinary course in our evaluation of ongoing operating performance. We define “Adjusted Operating Income (Loss)” as operating income (loss) excluding other non-cash items and other items that we do not consider ordinary course in our evaluation of ongoing operating performance.
Non-U.S. GAAP measures should not be considered a substitute for, or superior to, financial measures calculated in accordance with U.S. GAAP. EBITDA, Adjusted Net Income, Adjusted EBITDA Adjusted Diluted EPS, Adjusted Gross Profit and Adjusted Operating Income (Loss) exclude significant expenses that are required by U.S. GAAP to be recorded in our financial statements and is subject to inherent limitations. In addition, other companies in our industry may calculate this non-U.S. GAAP measure differently than we do or may not calculate it at all, limiting its usefulness as a comparative measure.
In accordance with SEC rules, we have provided, in the supplemental information attached, a reconciliation of the non-GAAP measures to the next directly comparable GAAP measures.