![]()
Surna Reports Q2 2018 Results
BOULDER, Colorado, Aug. 14, 2018 /PRNewswire/ — Surna Inc. (OTCQB: SRNA) announced today operating and financial results for the three and six months ended June 30, 2018. Surna Inc. designs, engineers and manufactures application-specific environmental control and air sanitation systems for commercial, state- and provincial-regulated indoor cannabis cultivation facilities in the U.S. and Canada.
Summary Financial Results for Q2 2018
- Our Q2 2018 revenue was $2,008,000, a decrease of $47,000, or 2%, compared to Q1 2018.
- We had Q2 2018 net bookings of $3,867,000, a decrease of $756,000, or 16%, compared to Q1 2018. See “Project Life-Cycle and Backlog” below.
- Our ending backlog as of June 30, 2018 was $8,883,000, an increase of $1,859,000, or 26%, compared to our March 31, 2018 backlog, and our largest quarter-end backlog.
- Our Q2 2018 gross profit margin was 26%, an increase of seven percentage points from our Q1 2018 gross profit margin.
- We realized a Q2 2018 net loss of $1,401,000 as compared to a Q1 2018 net loss of $1,884,000, a decrease of $483,000, or 26%. The Q2 2018 net loss included $853,000 of non-cash, stock-based compensation expenses as compared to $641,000 of non-cash, stock-based compensation expenses and $21,000 of non-cash gain related to debt instruments in Q1 2018.
- As of June 30, 2018, we had cash and cash equivalents of $1,629,000, compared to cash and cash equivalents of $881,000 as of March 31, 2018. The $748,000 increase in cash and cash equivalents during Q2 2018 was primarily the result of cash provided by our financing activities of $816,000, which includes our private placement offering of $1,210,000, offset by our common share repurchase of $400,000.
Financial Summary Results for First Half of 2018
- Revenue for the first half of 2018 was $4,062,000 compared to $3,335,000 for the first half of 2017, an increase of $727,000, or 22%.
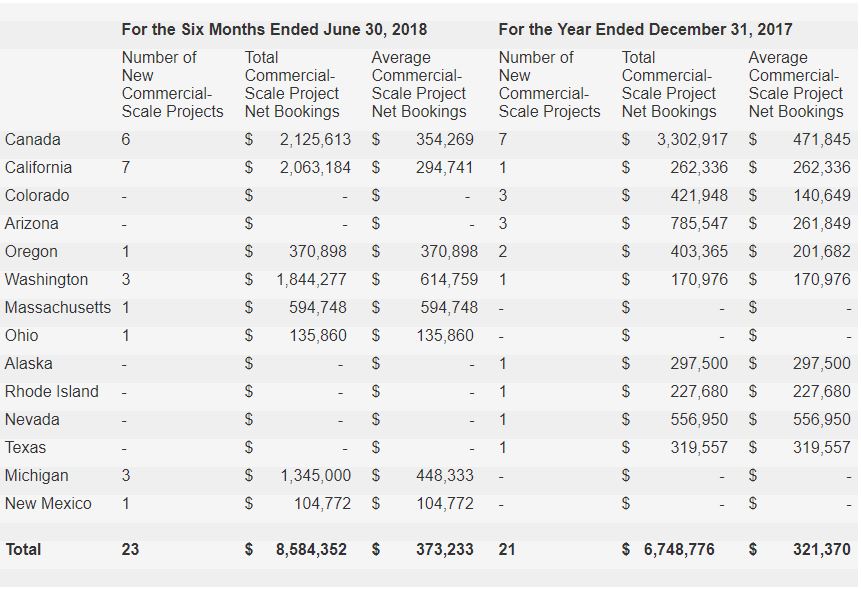
- During the first half of 2018, we entered into sales orders for 23 projects, each with a sales value over $100,000, which we refer to as commercial-scale projects. These commercial-scale projects represented aggregate net bookings of $8,584,000 for the first half of 2018. This compares to 21 commercial-scale projects representing aggregate net bookings of $6,749,000 for the entire 2017 year.
- We had a net loss of $3,284,000 for the first half of 2018, as compared to a net loss of $2,074,000 for the first half of 2017, an increase of $1,210,000, or 58%. The net loss included $1,493,000 of non-cash, stock-based compensation expenses in the first half of 2018 as compared to non-cash, stock-based compensation expense of $392,000 and debt-related expenses of $291,000 in the first half of 2017.
We are pleased with the continued pace of demand for our products and services, as evidenced by strong net bookings in the first half of 2018. Going into Q3 2018 with our largest backlog in history, we look forward to growing recognized revenues over the next two quarters as these projects move towards completion. While we are excited about our growing backlog, we also remain focused on providing better visibility to our shareholders and improving our ability to predict with some level of certainty when and how much of our backlog will be converted into revenue over time.
 Chris Bechtel, CEO
Results of Operations
Revenue for the three months ended June 30, 2018 was $2,008,000 compared to $1,742,000 for the three months ended June 30, 2017, an increase of $266,000, or 15%. Although our net bookings trended favorably and our backlog grew during 2018, revenue recognition continues to be impacted by our long and uncertain project life-cycle and delays faced by our customers in the construction of new cultivation facilities.
Cost of revenue increased by $155,000, or 12%, from $1,329,000 for the three months ended June 30, 2017 to $1,484,000 for the three months ended June 30, 2018. The gross profit for the three months ended June 30, 2018 was $523,000 compared to $413,000 for the three months ended June 30, 2017. Gross profit margin increased by two percentage points from 24% for the three months ended June 30, 2017 to 26% for the three months ended June 30, 2018. This increase was due primarily to higher gross profit margin on our equipment sales, which were offset by lower gross profit margins on our engineering services and shipping and handling.
Operating expenses increased by 21% from $1,610,000 for the three months ended June 30, 2017 to $1,941,000 for the three months ended June 30, 2018, an increase of $331,000. The operating expense increase consisted of: (i) an increase in selling, general and administrative expenses (“SG&A expenses”) of $356,000, and (ii) an increase in advertising and marketing expenses of $14,000, offset by (iii) a decrease in product development expense of $39,000.
The increase in SG&A expenses for the three months ended June 30, 2018 compared to the three months ended June 30, 2017, was due primarily to: (i) an increase of $542,000 in stock-related compensation paid to employees, (ii) an increase of $73,000 in salaries and benefits, (iii) an increase of $235,000 in consulting fees (of which $193,000 were paid in stock), offset by (iv) a decrease $37,000 in accounting, legal and other professional fees, and (v) a decrease of $442,000 in stock-related compensation paid to our independent directors.
We had an operating loss of $1,417,000 for the three months ended June 30, 2018, as compared to an operating loss of $1,197,000 for the three months ended June 30, 2017, an increase of $220,000, or 18%. The operating loss included $853,000 of non-cash, stock-based compensation expenses in the three months ended June 30, 2018 as compared to $262,000 for the three months ended June 30, 2017. Excluding these non-cash items, our operating loss decreased by $371,000.
Overall, we had a net loss of $1,401,000 for the three months ended June 30, 2018 as compared to a net loss of $1,073,000 for the three months ended June 30, 2017, an increase of $328,000, or 31%. The net loss included $853,000 of non-cash, stock-based compensation expenses in the three months ended June 30, 2018 as compared to non-cash, stock-based compensation expense of $262,000 and debt-related income (net) of $123,000 in the three months ended June 30, 2017.
Increased Commercial-Scale Project Bookings
Recent and anticipated regulatory changes involving medicinal and/or recreational cannabis use in various jurisdictions, such as California and Canada, tend to be a leading indicator for the granting of licenses for new facility construction. As more new cultivation facilities become licensed, we in turn have an expanded set of potential customers that might buy our climate control systems.
For 2018, we are pursuing customers seeking to build larger indoor cannabis cultivation facilities in all regulated markets, with special focus in California and Canada. In Canada, medicinal use of cannabis is federally legal, and the Canadian federal government recently legalized recreational use effective October 2018. On June 26, 2018, Oklahoma voters approved a medical cannabis ballot initiative. We also believe that Michigan will offer opportunities in 2018 as the state attempts to move to a recreational use regulated market, with the second-largest medical cannabis patient base in the U.S. In November 2018, voters in Michigan will consider an initiative legalizing and regulating recreational use of cannabis. Utah voters will also decide on a medical cannabis ballot measure in November 2018.
During the three months ended June 30, 2018, we entered into sales orders for 12 commercial-scale projects, each with a sales value over $100,000. These commercial-scale projects represented aggregate net bookings of $4,145,000 for the three months ended June 30, 2018. For the six months ended June 30, 2018, we entered into sales orders for 23 commercial-scale projects with aggregate net bookings of $8,584,000. This compares to 21 commercial-scale projects representing aggregate net bookings of $6,749,000 for the year ended December 31, 2017. The California and Canadian markets each showed signs of strength for us through the first half of 2018, and we expect this trend to continue through the remainder of 2018. The following table sets forth our net bookings of commercial-scale projects for each cohort period presented (meaning, the commercial-scale contracts executed during each period for which we received an initial deposit, adjusted for any change orders or cancellations for that cohort group to date) by country/state.
Project Life-Cycle and Backlog
The project life-cycle for our commercial projects continues to vary significantly. From the execution of the sales contract, to engineering services and equipment delivery, and all the way through installation and commissioning of the installed system, which we refer to as our project life-cycle, the project can take anywhere from four months to two years to complete. The longer the project life-cycle, the longer it takes for us to recognize revenue on booked sales orders. Since we do not install the climate control systems, our customers are required to use third-party installation contractors, which adds to the variability in the project life-cycle and our revenue recognition.
The time it takes for our customer to complete a project, which corresponds to when we are able to recognize revenue, is driven by numerous factors including:
- the large number of first-time participants interested in the indoor cannabis cultivation business;
- the complexities and uncertainties involved in obtaining state and local licensure and permitting;
- local and state government delays in approving licenses and permits due to lack of staff or the large number of pending applications, especially in states where there is no cap on the number of cultivators;
- the customer’s need to obtain cultivation facility financing;
- the time needed, and coordination required, for our customers to acquire real estate and properly design and build the facility (to the stage when climate control systems can be installed);
- the large price tag and technical complexities of the climate control and air sanitation system;
- the availability of power; and
- delays that are typical in completing any construction project.
Because of the foregoing factors, there are risks that we may not realize the full contract value of these projects in a timely manner or at all. Completion of a customer’s cultivation facility project is dependent upon the customer’s ability to secure funding and real estate, obtain a license and then build their cultivation facility so they can take possession of the equipment.
Given the timing of the deliverables in our sales contracts, we can experience large variances in quarterly revenue. Our revenue recognition is dependent upon shipment of the equipment portions of our sales contracts, which, in many cases, may be delayed while our customers complete permitting, prepare their facilities for equipment installation or obtain project financing. Industry uncertainty, project financing concerns, and the licensing and qualification of our prospective customers, which are out of our control, make it difficult for us to predict when we will recognize revenue.
The following table sets forth: (i) our beginning backlog (the remaining contract value of outstanding sales contracts for which we have received an initial deposit as of the previous period), (ii) our net bookings for the period (new sales contracts executed during the period for which we received an initial deposit, net of any adjustments including change orders during the period), (iii) our recognized revenue for the period, and (iv) our ending backlog for the period (the sum of the beginning backlog and net bookings, less recognized revenue).
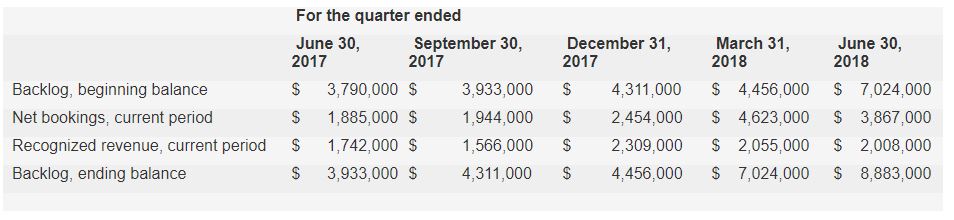 During the three months ended June 30, 2018, (i) our net bookings were $3,867,000, a decrease of $756,000, or 16%, compared to the prior quarter, and (ii) our recognized revenue was $2,008,000, a decrease of $47,000, or 2%, compared to the prior quarter. We believe net bookings in any given cohort quarter are our best leading indicator of revenue that we may recognize in the ensuing two to eight quarters from that cohort.
As of June 30, 2018, our ending backlog was $8,883,000, an increase of $1,859,000, or 26%, compared to the prior quarter-end. About 53% of our June 30, 2018 ending backlog (down from 78% at March 31, 2018) is attributable to projects for which we have only received an initial deposit and, as a result, there are potential risks that the equipment portion of these projects will not be completed or will be delayed.
Backlog and net bookings may not be indicative of future operating results, and our customers may attempt to renegotiate or terminate their contracts for a number of reasons, including delays in or inability to obtain project financing or licensing. Accordingly, there can be no assurance that contracts included in backlog will actually generate revenues or when the actual revenues will be generated. Backlog and net bookings are considered non-GAAP financial measures, and therefore, they should be considered in addition to, rather than as a substitute for, recognized revenue and deferred revenue. Further, we can provide no assurance as to the profitability of our contracts reflected in backlog and net bookings. See “Non-GAAP Financial Measures” below.
Balance Sheet and Capital Requirements
During Q2 2018, we raised $1,210,000 in a private placement offering of investment units, at a price of $0.16 per unit. Each unit consisted of one share of common stock and one warrant for the purchase of one share of common stock. We issued a total of 7,562,500 units in the offering, and no commissions or fees were paid. The proceeds from the offering will be used for working capital and general corporate purposes. In addition, we used $400,000 from the proceeds of the offering to repurchase shares of common stock from our co-founders, Stephen and Brandy Keen.
As of June 30, 2018, we had cash and cash equivalents of $1,629,000, compared to cash and cash equivalents of $2,468,000 as of December 31, 2017. The $839,000 decrease in cash and cash equivalents during the six months ended June 30, 2018 was primarily the result of: (i) cash used in our operating activities of $1,511,000, (ii) cash used in our investing activities of $144,000, which are primarily related to improvements made to our leased manufacturing facility, and (iii) cash provided by our financing activities of $816,000, which includes our private placement offering of $1,210,000, offset by our common share repurchase of $400,000.
Based on management’s estimate for our operational cash requirements, we may need to raise financing during the fourth quarter of 2018 or the first quarter of 2019 in order to continue our operations and achieve our growth targets. There can be no assurance that we will be able to raise debt or equity financing in sufficient amounts, when and if needed, on acceptable terms or at all.
About Surna Inc.
Surna Inc. (www.surna.com) designs, engineers and manufactures application-specific environmental control and air sanitation systems for commercial, state- and provincial-regulated indoor cannabis cultivation facilities in the U.S. and Canada. Our engineering and technical team provides energy and water efficient solutions that allow growers to meet the unique demands of a cannabis cultivation environment through precise temperature, humidity, light, and process controls and to satisfy the evolving code and regulatory requirements being imposed at the state and local levels.
Headquartered in Boulder, Colorado, we leverage our experience in this space in order to bring value-added climate control solutions to our customers that help improve their overall crop quality and yield as well as optimize the resource efficiency of their controlled environment (i.e., indoor and greenhouses) cultivation facilities. We have been involved in consulting, equipment sales and/or full-scale design for over 700 grow facilities since 2006 making us a trusted resource for indoor environmental design and control management for the cannabis industry.
Our customers have included small cultivation operations to licensed commercial facilities ranging from several thousand to more than 100,000 square feet. We have sold our equipment and systems throughout the U.S. and Canada as well as internationally in South Africa, Switzerland and the United Kingdom. Our revenue stream is derived primarily from supplying mechanical engineering services and climate and environmental control equipment to commercial indoor cannabis grow facilities. We also sell equipment to smaller cultivators who can purchase either directly from us, or from our authorized wholesalers or retailers. Though our customers do, we neither produce nor sell cannabis.