Aurora Cannabis Announces Fiscal 2022 Second Quarter Results
- Global Cannabis Net Revenue of $60.6 Million
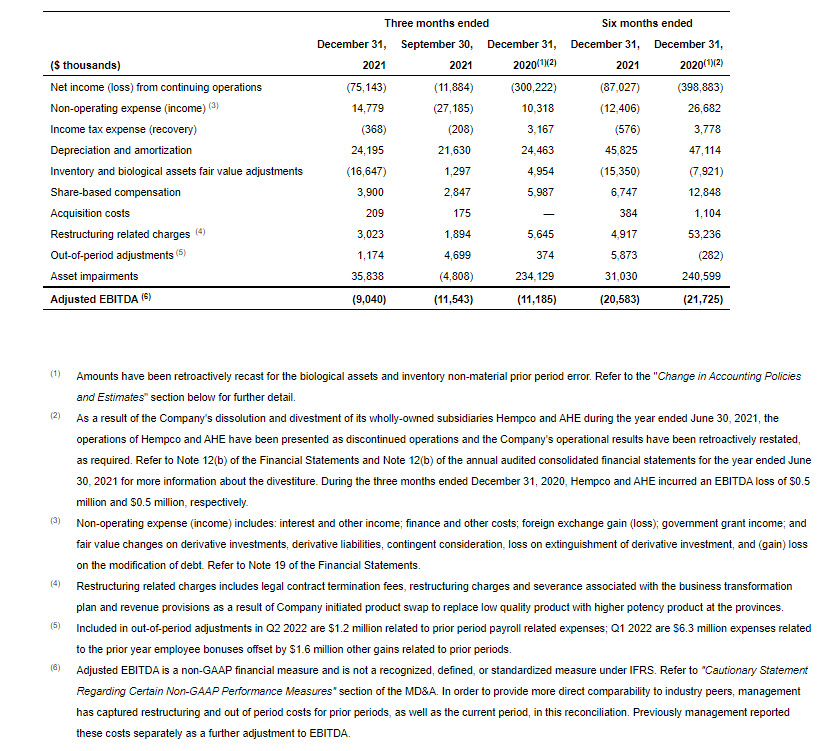
- Adjusted EBITDA Improved by 22% to a loss of $9.0 Million versus Q1 2022
- Company Reaffirms Goal of Adjusted EBITDA Profitability by H1/2023
- Transformation Plan Ahead of Schedule; Company Now Expects to Realize Upper End of $60 to $80 Million Range in Total Cost Savings by H1/2023; ~$60 Million Annualized Savings Implemented to Date
- Company Remains #1 Canadian LP in Global Medical Cannabis; International Cannabis Revenue Increased 24% from Q1 2022
EDMONTON, AB, Feb. 10, 2022 /PRNewswire/ – Aurora Cannabis Inc. (the “Company” or “Aurora”) (NASDAQ: ACB) (TSX: ACB), the Canadian company defining the future of cannabinoids worldwide, today announced its financial and operational results for the second quarter fiscal 2022 ended December 31, 2021.
During the second quarter, we improved our Adjusted EBITDA by $2.5 million over Q1, moving us closer to our profitability goal. Our focus remains on further cost reductions, and we are pleased to announce today that we expect to reach the high end of the $60 to $80 million range.
 Miguel Martin, Chief Executive Officer of Aurora.
Our balance sheet remains among the strongest in the industry, with approximately $445 million in cash as of yesterday. This gives us significant working capital to support organic growth and positions us to pursue strategic M&A opportunities.
“Q2 total cannabis net revenue held steady sequentially, driven by our industry leading, high margin global medical cannabis business. New international markets are rapidly opening, and with the unique ability to navigate complex regulatory environments, we see a significant revenue opportunity of which we are at the forefront. While the Canadian adult-use market continues to face challenges, we are focused on introducing a new range of products set to launch this spring,” he concluded.
Second Quarter 2022 Highlights
(Unless otherwise stated, comparisons are made between fiscal Q2 2022, Q1 2022, and Q2 2021 results and are in Canadian dollars)
Medical Cannabis:
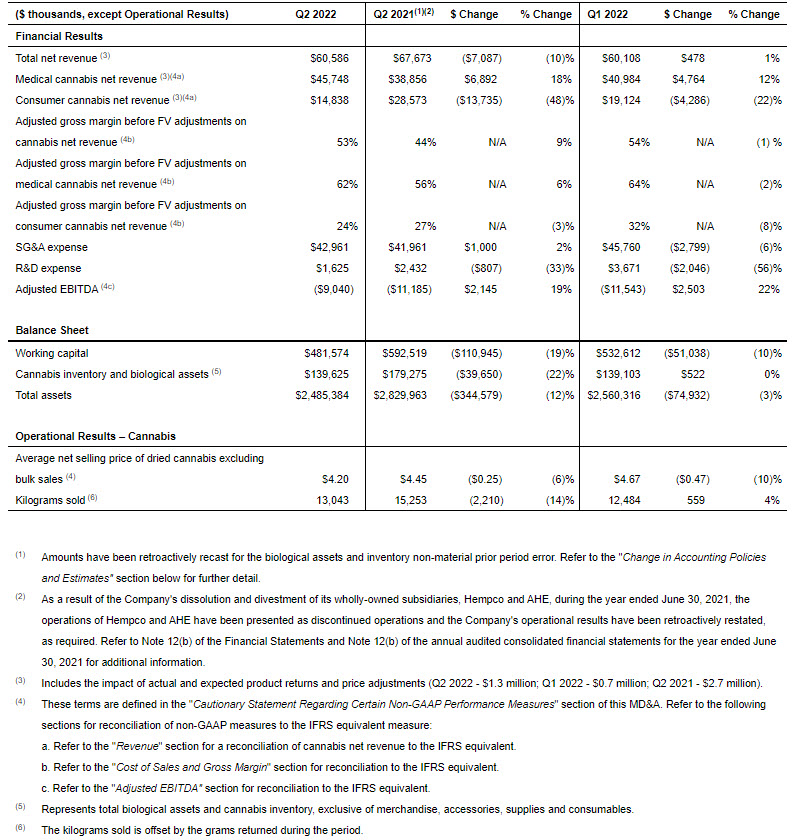
- Medical cannabis net revenue1 was $45.7 million, an 18% increase from the prior year period, delivering 76% of Aurora’s Q2 2022 consolidated revenue and 89% of adjusted gross profit.
- The increase in revenue was driven by continued growth in the international medical business, up 24% sequentially and 67% year over year, as the Company continued to develop new, high margin medical markets. We do not currently expect to recognize revenue from shipments to Israel in Q3.
- Net revenue in Q2 2022 includes a provision recorded against international revenue of $2.4 million for certain current and prior period international shipments that were either above or below target THC potency ranges. Management does not expect this level of provision to recur. Year over year international revenue growth, excluding the provision was 87%.
- Adjusted gross margin before fair value adjustments on medical cannabis net revenue1 was 62% compared to 64% sequentially and 56% in the prior year period. The year over year improvement was a result of an increase in international sales which yield higher margins and an overall reduction in production costs due to the closure of non-core facilities as part of our business transformation plan.
Consumer Cannabis:
- Consumer cannabis net revenue1 was $14.8 million compared to the prior quarter net revenue of $19.1 million, with the decline due mainly to industry-wide pricing pressures across our portfolio and an 18% decrease of kilograms and equivalent sold compared to the prior quarter. This was partially offset by a positive 5% mix shift in the Company’s brand mix from Daily Special to San Rafael ’71, as the Aurora continues to pivot towards premium offerings.
- Adjusted gross margin before fair value adjustments on consumer cannabis net revenue1 was 24% versus 32% sequentially and 27% in the prior year period. The decrease of 8% from Q1 2022 was mainly related to industry-wide pricing compression, offset by a 2% improvement from Aurora’s continuing shift toward a premium product portfolio. Additionally, the clear out of aging and low potency consumer cannabis through bulk wholesale channels impacted margins negatively by 4%. Excluding the discounted bulk sales, which are not expected to recur regularly, the Company’s consumer adjusted gross margin would be 28%.
Selling, General and Administrative (“SG&A”):
- SG&A, including Research and Development (“R&D”), was $40.9 million (excluding $2.5 million of restructuring related costs and $1.2 million of prior period employee-related accruals) versus $44.0 million in the prior quarter and $43.3 million in the prior year period, presented on a comparable basis.
Consolidated:
- Q2 2022 total cannabis net revenue1 was $60.6 million, up 1% sequentially. The Q2 2022 average net selling price per gram of dried cannabis1, excluding the effect of bulk wholesale of excess mid-potency cannabis flower, declined 10% to $4.20 from $4.67 in Q1 2022 reflecting continued downward pressures on pricing due to competition.
- Adjusted gross margin before fair value adjustments on cannabis net revenue1 was 53% in Q2 2022 versus 54% in the prior quarter and 44% in Q2 2021. The increase in Adjusted gross margin compared to the prior year period is due to increased sales in our international medical markets which command significantly higher average net selling prices and margins.
- Adjusted EBITDA1 loss improved to $9.0 million in Q2 2022 versus $11.5 million in Q1 2022 and $11.2 million in the prior year period. The decrease in loss as compared to Q1 2022 was primarily driven by the $3.1 million decrease in SG&A, net of restructuring and one-time costs, while revenue and Adjusted gross margins remained steady.
__________
1 These terms are non-GAAP measures, see “Non-GAAP Measures” below.
Operational Efficiency Plan, Balance Sheet Strength, & Working Capital Improvement:
Aurora has previously identified cash savings of $60 million to $80 million. We have already executed approximately $60 million in annualized run-rate cost savings to date, and now expect to reach the high end of this range by the end of H1 fiscal 2023.
Approximately 60% of the savings are expected to be removed from our network through asset consolidation, and operational and supply chain efficiencies. The remaining 40% of savings are intended to be sourced through SG&A. These cash savings will be reflected in our P&L either as they occur for SG&A savings, or as inventory is drawn down for production-related savings.
At December 31, 2021, Aurora had $383.8 million of cash, including $51.3 million in restricted cash, no secured term debt, and access to US$1.0 billion of capital under its shelf prospectus, including the full amount of a US$300 million at-the-market (ATM) facility. Subsequent to Q2 2022, the Company issued 19,595,000 common shares for gross proceeds of US$89.7 million under the ATM program. As disclosed previously, management considers the ATM to be available for strategic purposes.
Quarterly cash flow summary:
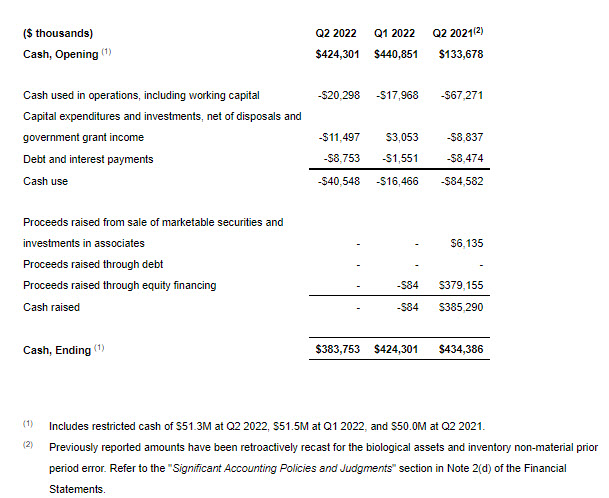
Refer to the “Consolidated Statement of Cash Flows” in the “Consolidated Financial Statements” for our cash flow statements prepared in accordance with IAS 7 – Statement of Cash Flows.
Conference Call
Aurora will host a conference call today, Thursday, February 10, 2022, to discuss these results. Miguel Martin, Chief Executive Officer, and Glen Ibbott, Chief Financial Officer, will host the call starting at 5:00 p.m. Eastern time | 3:00 p.m. Mountain Time. A question and answer session will follow management’s presentation.
Conference Call Details
DATE: Thursday, February 10, 2022
TIME: 5:00 p.m. Eastern Time | 3:00 p.m. Mountain Time
WEBCAST: https://viavid.webcasts.com/starthere.jsp?ei=1524077&tp_key=b38bc0a5e1
Investors may submit questions in advance or during the conference call itself through the weblink listed above. This weblink has also been posted to the Company’s “Investor Info” link at https://investor.auroramj.com/ under “News & Events”.
About Aurora
Aurora is a global leader in the cannabis industry, serving both the medical and consumer markets. Headquartered in Edmonton, Alberta, Aurora is a pioneer in global cannabis, dedicated to helping people improve their lives. The Company’s adult-use brand portfolio includes Aurora Drift, San Rafael ’71, Daily Special, and Whistler, as well as CBD brands, Reliva and KG7. Medical cannabis brands include MedReleaf, CanniMed, Aurora and Whistler Medical Marijuana Co. Driven by science and innovation, and with a focus on high-quality cannabis products, Aurora’s brands continue to break through as industry leaders in the medical, performance, wellness and adult recreational markets wherever they are launched. Learn more at www.auroramj.com and follow us on Twitter and LinkedIn.
Aurora’s common shares trade on the NASDAQ and TSX under the symbol “ACB” and is a constituent of the S&P/TSX Composite Index.
Non-GAAP Measures
This news release contains certain financial performance measures that are not recognized or defined under IFRS (termed “Non-GAAP Measures”). As a result, this data may not be comparable to data presented by other licensed producers of cannabis and cannabis companies. For an explanation of these measures to related comparable financial information presented in the consolidated financial statements prepared in accordance with IFRS, refer to the discussion below. The Company believes that these Non-GAAP Measures are useful indicators of operating performance and are specifically used by management to assess the financial and operational performance of the Company. These Non-GAAP Measures include, but are not limited, to the following:
- Cannabis net revenue represents revenue from the sale of cannabis products, excluding excise taxes. Cannabis net revenue is further broken down as follows:
- Medical cannabis net revenue represents Canadian and international cannabis net revenue for medical cannabis sales only.
- Consumer cannabis net revenue represents cannabis net revenue for consumer cannabis sales only.
- Wholesale bulk cannabis net revenue represents cannabis net revenue for wholesale bulk cannabis only.
- Ancillary net revenue represents non-cannabis net revenue for ancillary support functions only.
- Management believes the cannabis net revenue measures provide more specific information about the net revenue purely generated from our core cannabis business and by market type.
- Average net selling price per gram and gram equivalent is calculated by taking cannabis net revenue and removing the impact of cost of sales net against revenue in agency relationships, which is then divided by total grams and grams equivalent of cannabis sold in the period. Average net selling price per gram and gram equivalent is further broken down as follows:
- Average net selling price per gram of dried cannabis represents the average net selling price per gram for dried cannabis sales only, excluding wholesale bulk cannabis sold in the period.
- Average net selling price per gram of international dried cannabis represents the average net selling price per gram for international dried cannabis sales only, excluding wholesale bulk cannabis sold in the period.
- Average net selling price per gram and gram equivalent of Canadian medical cannabis represents the average net selling price per gram and gram equivalent for dried cannabis and cannabis derivatives sold in the Canadian medical market.
- Average net selling price per gram and gram equivalent of medical cannabis represents the average net selling price per gram and gram equivalent for dried cannabis and cannabis derivatives sold in the medical market.
- Average net selling price per gram and gram equivalent of consumer cannabis represents the average net selling price per gram and gram equivalent for dried cannabis and cannabis derivatives sold in the consumer market.
- Management believes the average net selling price per gram or gram equivalent measures provide more specific information about the pricing trends over time by product and market type. Under an agency relationship, revenue is recognized net of cost of sales in accordance with IFRS. Management believes the removal of agency cost of sales in determining the average net selling price per gram and gram equivalent is more reflective of our average net selling price generated in the marketplace.
- Gross profit before FV adjustments on cannabis net revenue is calculated by subtracting (i) cost of sales, before the effects of changes in FV of biological assets and inventory, and (ii) cost of sales from non-cannabis ancillary support functions, from total cannabis net revenue. Gross margin before FV adjustments on cannabis net revenue is calculated by dividing gross profit before FV adjustments on cannabis net revenue divided by cannabis net revenue. Management believes that these measures provide useful information to assess the profitability of our cannabis operations as it excludes the effects of non-cash FV adjustments on inventory and biological assets, which are required by IFRS.
- Adjusted gross profit before FV adjustments on cannabis net revenue represents cash gross profit and gross margin on cannabis net revenue and is calculated by subtracting from total cannabis net revenue (i) cost of sales, before the effects of changes in FV of biological assets and inventory; (ii) cost of sales from non-cannabis ancillary support functions; and removing (iii) depreciation in cost of sales; (iv) cannabis inventory impairment; and (v) out-of-period adjustments. Adjusted gross margin before FV adjustments on cannabis net revenue is calculated by dividing Adjusted gross profit before FV adjustments on cannabis net revenue divided by cannabis net revenue. Adjusted gross profit and gross margin before FV adjustments on cannabis net revenue is further broken down as follows:
- Adjusted gross profit and gross margin before FV adjustments on medical cannabis net revenue represents gross profit and gross margin before FV adjustments on sales generated in the medical market only.
- Adjusted gross profit and gross margin before FV adjustments on consumer cannabis net revenue represents gross profit and gross margin before FV adjustments on sales generated in the consumer market only.
- Adjusted gross profit and gross margin before FV adjustments on wholesale bulk cannabis net revenue represents gross profit and gross margin before FV adjustments on sales generated from wholesale bulk cannabis only.
- Adjusted gross profit and gross margin before FV adjustments on ancillary net revenue represents gross profit and gross margin before FV adjustments on sales generated from ancillary support functions only.
- Management believes that these measures provide useful information to assess the profitability of our cannabis operations as it represents the cash gross profit and margin generated from cannabis operations and excludes (i) out-of-period adjustments to provide information that reflects current period results; and (ii) excludes the effects of non-cash FV adjustments on inventory and biological assets, which are required by IFRS.
- Adjusted EBITDA is calculated as net income (loss) excluding interest income (expense), accretion, income taxes, depreciation, amortization, changes in fair value of inventory sold, changes in fair value of biological assets, share-based compensation, acquisition costs, foreign exchange, share of income (losses) from investment in associates, government grant income, fair value gains and losses on financial instruments, gains and losses on deemed disposal, losses on disposal of assets, restructuring charges, onerous contract provisions, out-of-period adjustments, and non-cash impairments of deposits, property, plant and equipment, equity investments, intangibles, goodwill, and other assets. Adjusted EBITDA is intended to provide a proxy for the Company’s operating cash flow and is widely used by industry analysts to compare Aurora to its competitors, and derive expectations of future financial performance for Aurora, and excludes out-of-period adjustments that are not reflective of current operating results. Adjusted EBITDA increases comparability between comparative companies by eliminating variability resulting from differences in capital structures, management decisions related to resource allocation, and the impact of FV adjustments on biological assets and inventory and financial instruments, which may be volatile and fluctuate significantly from period to period.
Non-GAAP measures should be considered together with other data prepared accordance with IFRS to enable investors to evaluate the Company’s operating results, underlying performance and prospects in a manner similar to Aurora’s management. Accordingly, these non-GAAP measures are intended to provide additional information and should not be considered in isolation or as a substitute for measures of performance prepared in accordance with IFRS.
Adjusted EBITDA
The following is the Company’s adjusted EBITDA: