A Detailed Look at Cannabis Sales in Maryland and Massachussetts
We are pleased to share with our readers overviews on two Eastern cannabis markets compiled by BDS Analytics for the month of February. BDS Analytics offers a full understanding of the evolving cannabis market though several offerings, including its GreenEdge Retail Sales Tracking, Consumer Insights, Industry Intelligence and CBD Market Monitor divisions. For those not familiar with the Colorado-based company, which was founded in 2015 and is run by co-founders CEO Roy Bingham and President Liz Stahura, we have been covering their progress since almost day 1.
BDS has been sharing data for Massachusetts only since October, so the comparisons to year ago levels aren’t available. Maryland, however, has data back to January 2019. Both of these relatively new limited-license markets are very different from the more mature Western cannabis markets that BDS has shared as well. We have been informed that BDS will be providing data for additional Eastern markets in the coming months.
Here is a closer look at each market, as detailed by BDS Analytics:
Maryland
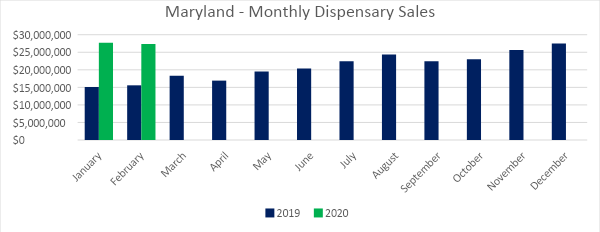
In February 2020, Cannabis sales in Maryland’s medical dispensaries reached $27.4 million, a one percent decline from January. Compared to the previous February, sales in Maryland increased by nearly 76 percent. Year-to-date through February, sales reached $55 million, a $24.4 million increase from the same period last year.
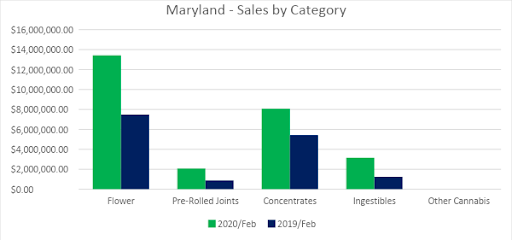
Flower sales accounted for more than 49 percent of overall monthly revenue with $13.4 million in sales. Pre-rolled Joints, which are tracked as a separate category, accounted for about eight percent of revenues with $2.1 million in sales. Compared to the previous February, sales of Flower grew by 79 percent and Pre-rolled Joints increased by 137 percent.
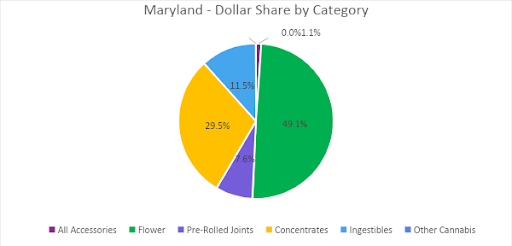
Concentrate sales accounted for thirty percent of overall February revenues totaling $8.1 million for the month and staying about the same as the trailing month. Vape products, the largest segment of the Concentrates category, generated $5.3 million in sales, making up 66 percent of the Maryland Concentrates market and over 19 percent of sales across all categories. Compared to February 2019, sales of Dabbable Concentrates grew by 65 percent, while Vape sales grew by 42 percent.
The Ingestibles category contributed 11 percent of sales in February with $3.1 million in revenue. In February, sales from Edibles generated about 89 percent of Ingestibles sales overall, growing three percent from January. Sublinguals sales made up the remaining 15 percent and declined 12 percent from the trailing month. Compared to the previous February, Edibles sales grew by 196 percent and Sublingual sales increased by 19 percent.
Massachusetts
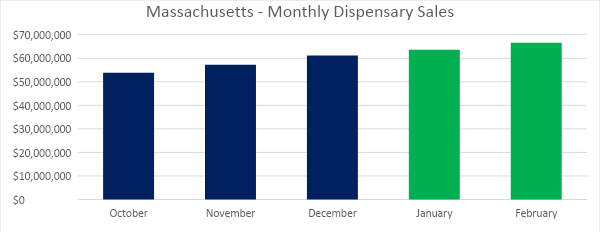
For the Massachusetts market. This initial launch includes coverage of retail sales tracking for both adult-use and medical sales channels from October 2019 through February 2020.
Total sales reported within the tracked time period:
- Adult-Use Sales = $247 million (Oct 19 – Feb 20)
- Medical Sales = $55 million (Oct 19 – Feb 20)
In February 2020, Cannabis sales in Massachusetts’s medical and adult use channels totaled at $66.6 million, growing five percent since January. Year-to-date through February, sales have exceeded $130.2 million.
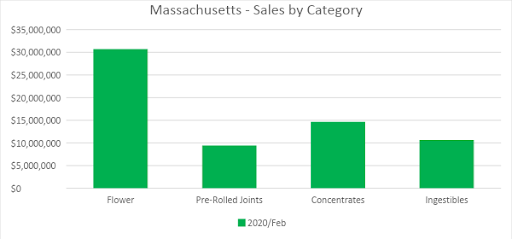
The Flower category accounted for over 46 percent of overall monthly revenues in February with $30.7 million in sales. Pre-rolled Joints, which are tracked as a separate category, accounted for nearly 14 percent of revenues with $9.4 million in sales. Compared to the trailing month, sales of Flower grew by four percent and Pre-rolled Joints increased by six percent.
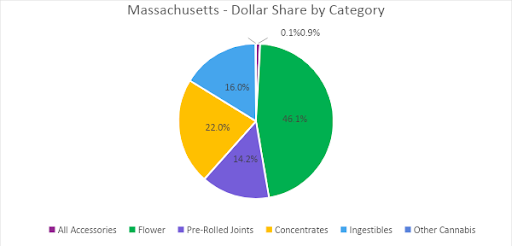
Concentrate sales accounted for nearly 22 percent of overall February revenues with sales totaling $14.6 million. Vape products, the largest segment of the Concentrates category, generated $10.4 million in sales. The category made up 71 percent of the Massachusetts Concentrates market and 16 percent of sales across all categories.
The Ingestibles category includes both Edibles and Sublinguals while also distinguishing the two subcategories. The Ingestibles category contributed 16 percent of overall sales in February with $10.7 million in monthly revenue. In February, the $9.1 million in sales from Edibles generated nearly 86 percent of Ingestibles sales overall, while Sublinguals made up the remaining 14 percent. Compared to the trailing month, Edibles sales grew by six percent and Sublingual sales declined by three percent.
For readers looking for a deeper look at cannabis markets across these two and more, including segmentation by additional product categories, brand and item detail, longer history, and segmentation by product attributes, learn how the BDS Analytics GreenEdge Platform can provide you with unlimited access to the most accurate and actionable data and analysis.