New Cannabis Ventures offers readers this easy-to-read exclusive summary of BDSA’s monthly cannabis sales data for 11 states.
Cannabis sales decreased 0.8% in August compared to July according to cannabis data analytics firm BDSA. In this review, we will look at the markets one-by-one, beginning with the eastern markets and then concluding with the western markets. In total, sales across the 11 markets totaled $1.67 billion during the month.
Eastern Markets
BDSA provides coverage for Florida, Illinois, Maryland, Massachusetts, Michigan and Pennsylvania. In August, year-over-year growth ranged from -12.7% in Maryland to 29.5% in Florida. Note that Florida, Maryland and Pennsylvania are medical-only markets.
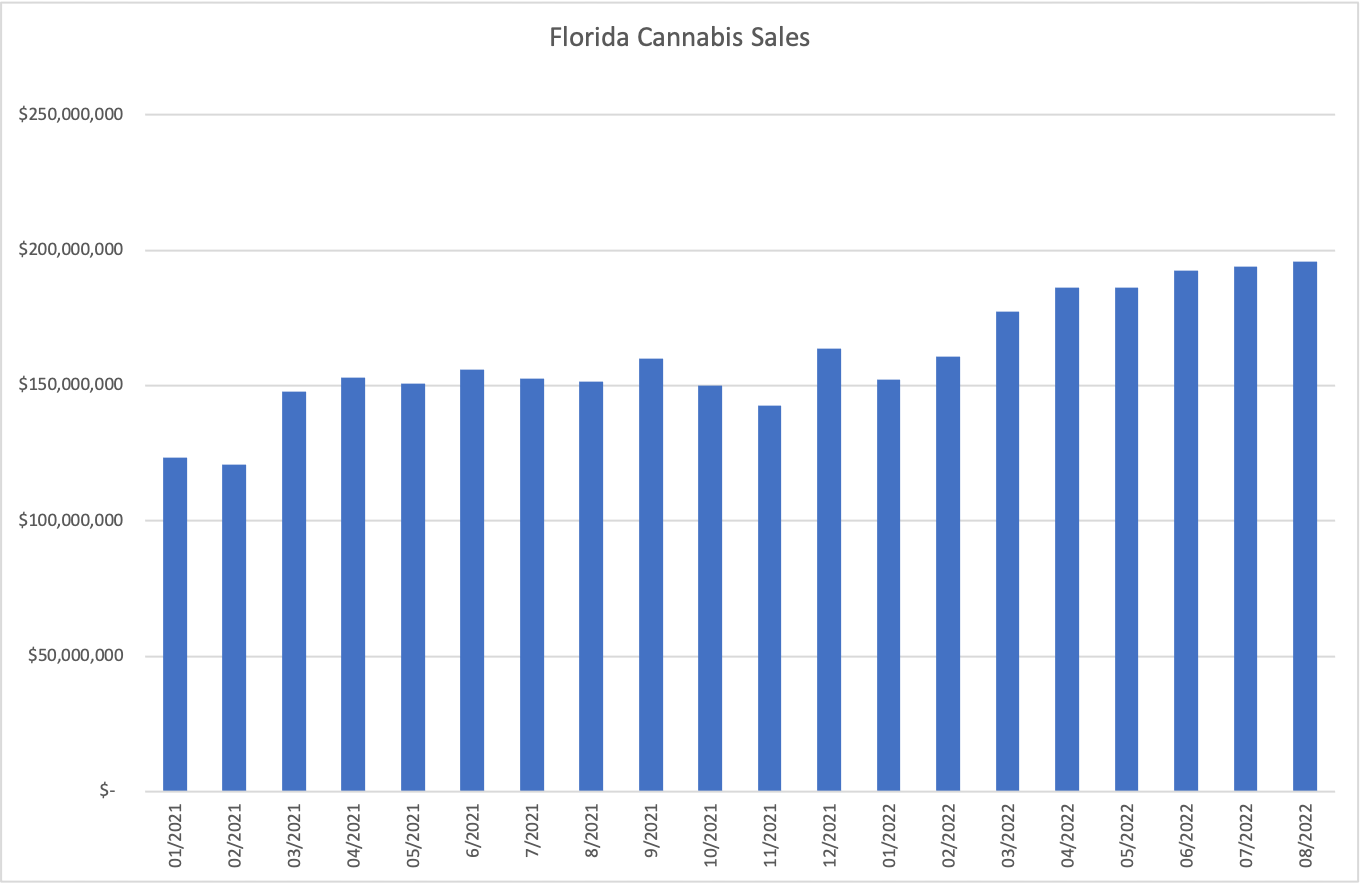
Florida
In August, sales increased 1.1% sequentially to $196 million, up 29.5% from a year ago. Flower sales grew 20%, pre-rolls increased 41%, ingestibles gained 19% and concentrates expanded 42% year-over-year.
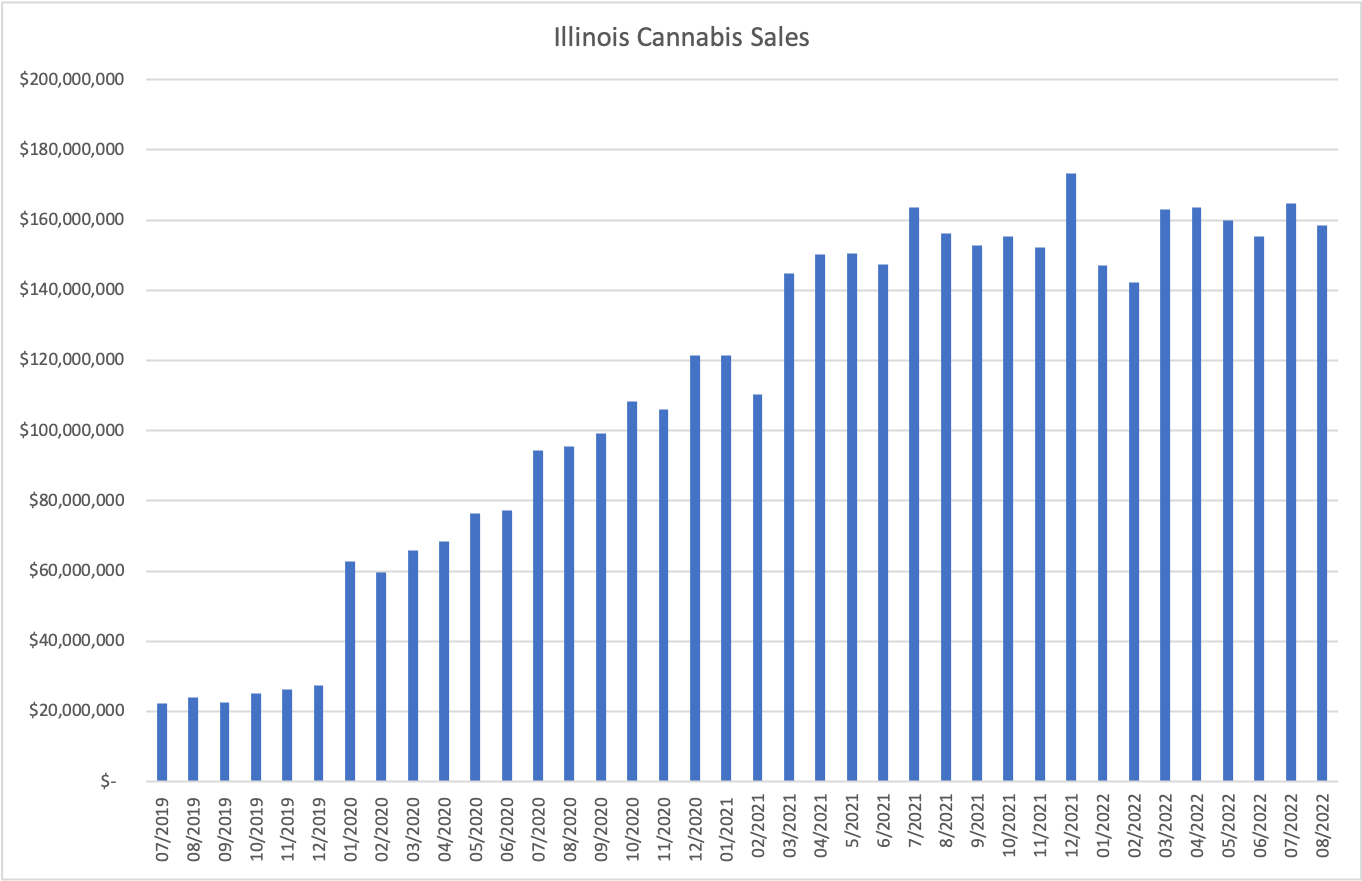
Illinois
We previously published data released by the state showing that sales declined 3.8% from July and increased 2.5% from August 2021. BDSA estimated sales of $158.4 million, down 3.8% sequentially and up 1.5% from a year ago. Compared to last year, flower sales declined 3%, pre-rolls jumped 39%, ingestibles fell 5% and concentrates increased 4%.
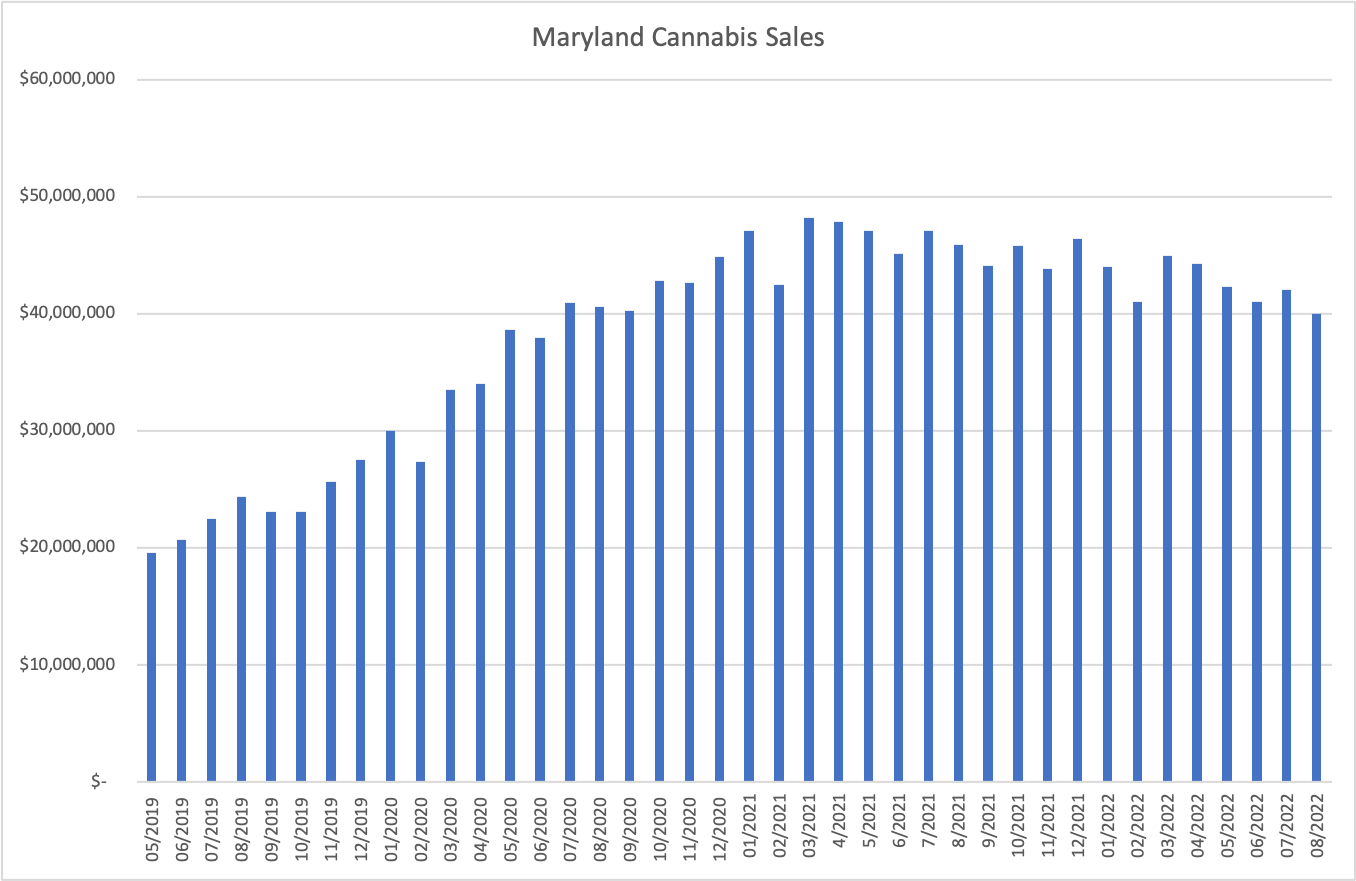
Maryland
Sales decreased 4.8% from July to $40 million, down 12.7% from a year ago. Flower sales decreased 10%, pre-rolls declined 15% and concentrates fell 22%, while ingestibles were down 1% year-over-year.
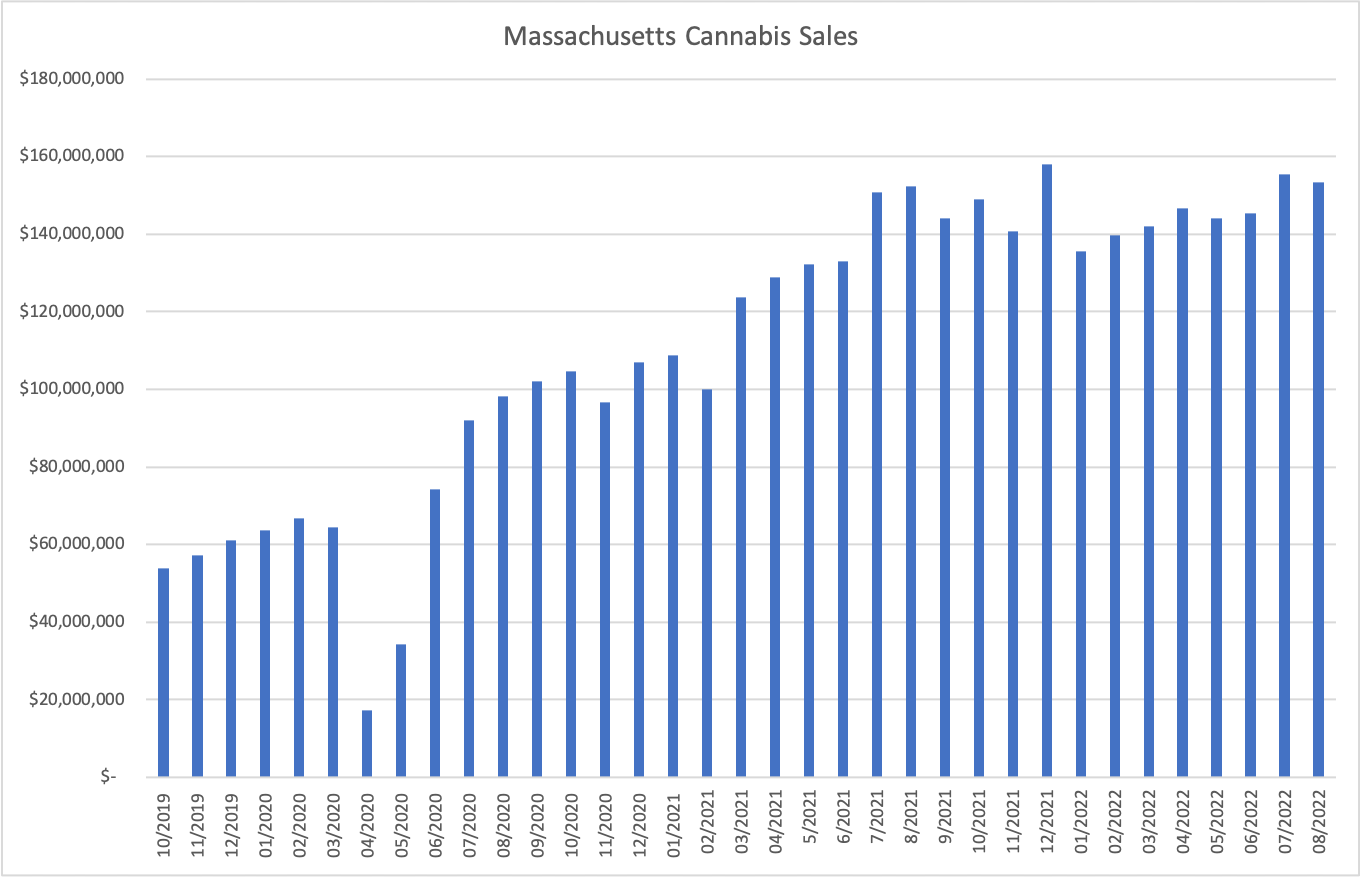
Massachusetts
Sales declined 1.4% sequentially and increased 0.6% compared to a year ago to $153.3 million. Flower sales grew 1% and ingestibles expanded 2%, pre-rolls increased 6% and concentrates declined 4% compared to last year.
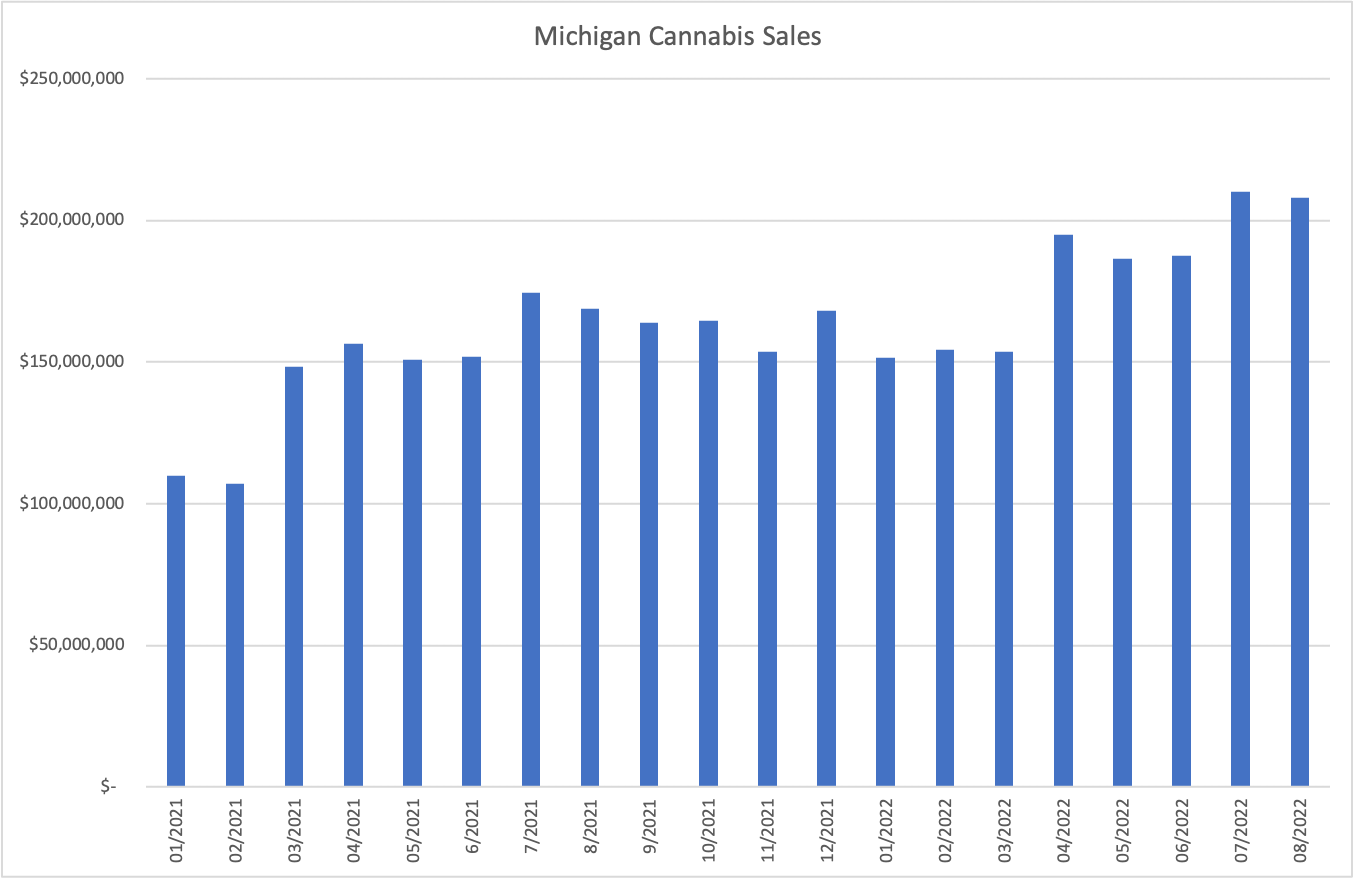
Michigan
We had previously written about data released by the state indicating that Michigan cannabis sales slipped 1% sequentially and increased 26% year-over-year. BDSA estimated sales of $207.9 million, down 1% sequentially and up 23.2% from a year ago. Flower sales increased 28%, while concentrates grew 23%. Pre-rolls jumped 49% and ingestibles gained 1% compared to prior year.
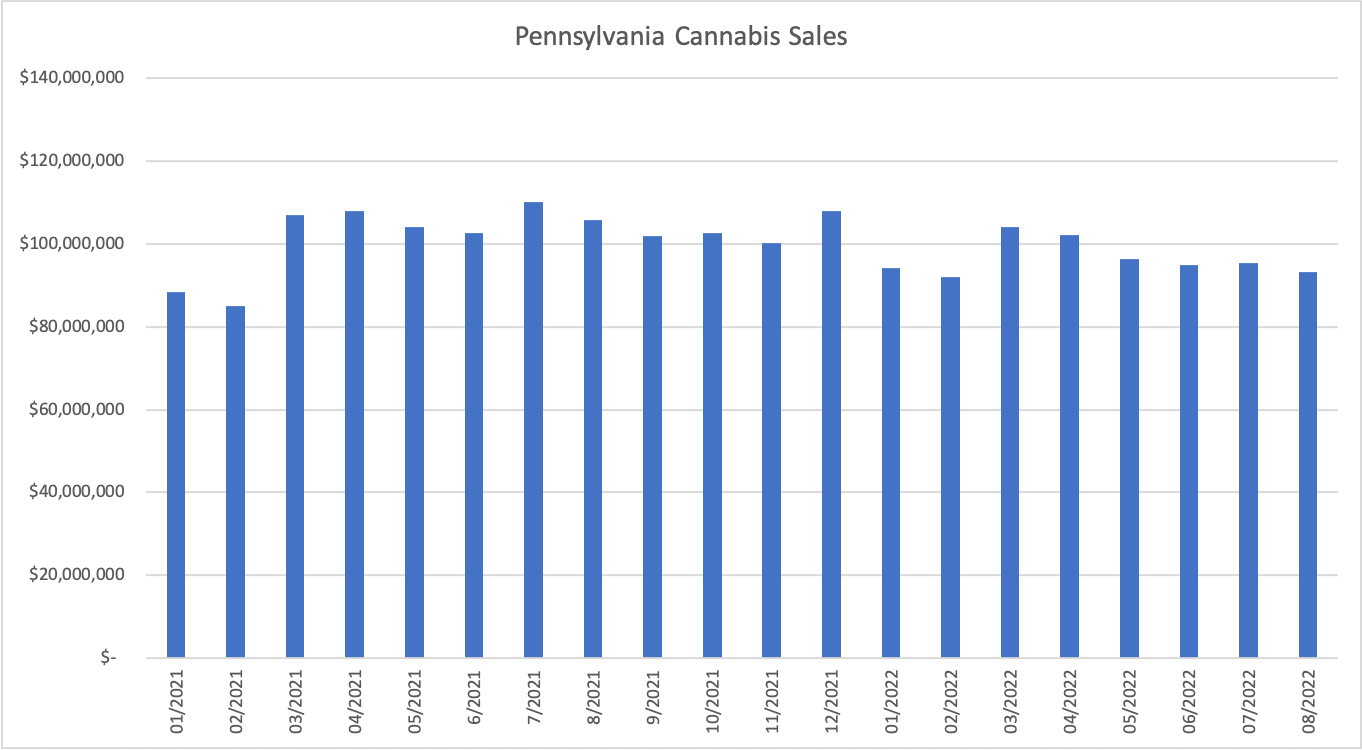
Pennsylvania
Sales declined 2.3% in August to $93.1 million, down 11.8% compared to a year ago. Flower sales declined 10% year-over-year, concentrates fell 14%, while ingestibles were down 2%.
Western Markets
BDSA provides coverage for Arizona, California, Colorado, Nevada and Oregon. In August, year-over-year growth ranged from -27.2% in Nevada to -3.8% in California compared to a year ago.
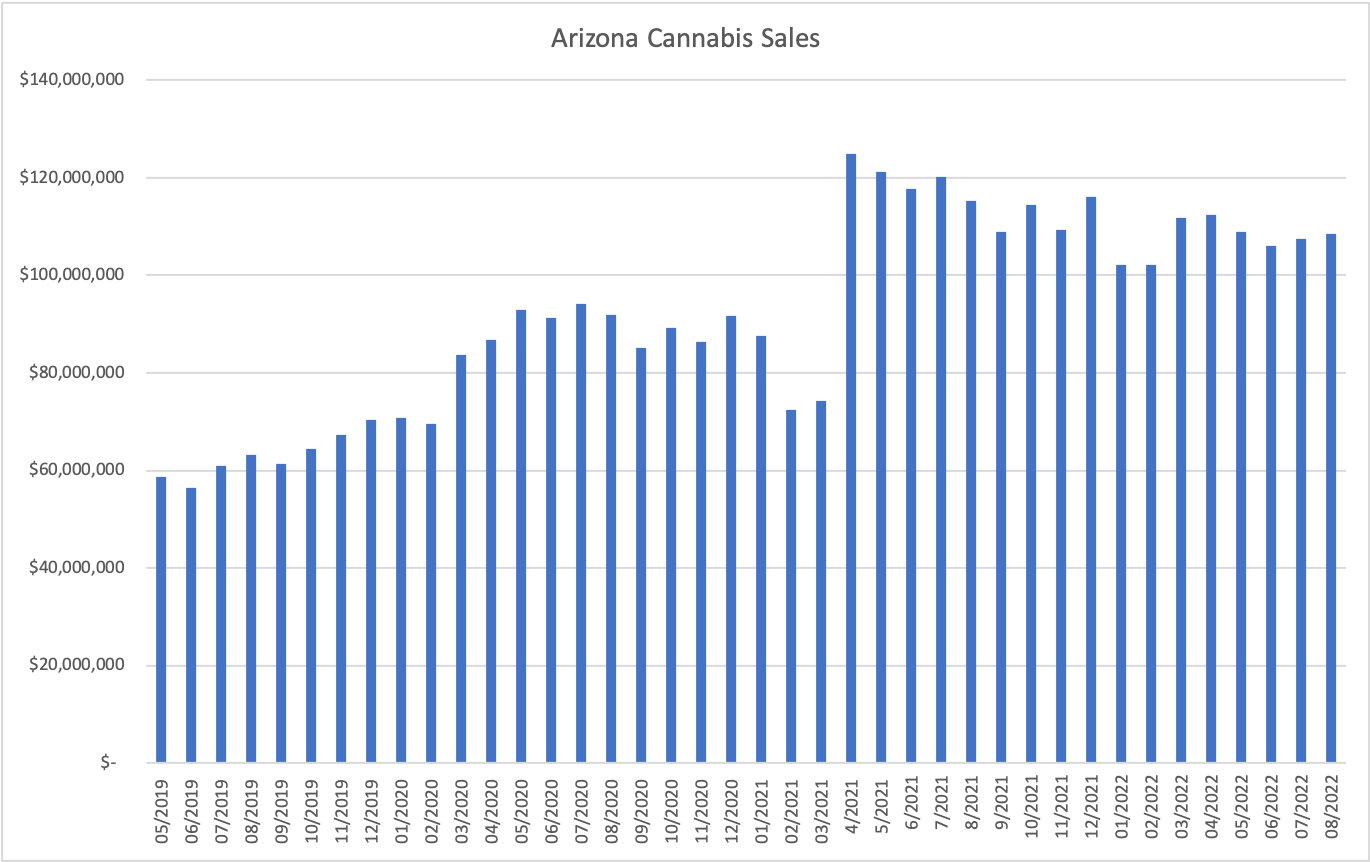
Arizona
Combined sales of $108.4 million were up 0.9% from July and down 5.9% compared to August 2021. Medical sales of $42.3 million were down 3% sequentially and down 30% from a year ago. Adult-use sales of $66.1 million gained 3% from July and 20% year-over-year. Flower sales were down 17% from a year ago, while pre-rolls grew 40%. Concentrates fell 7% and ingestibles gained 7%.
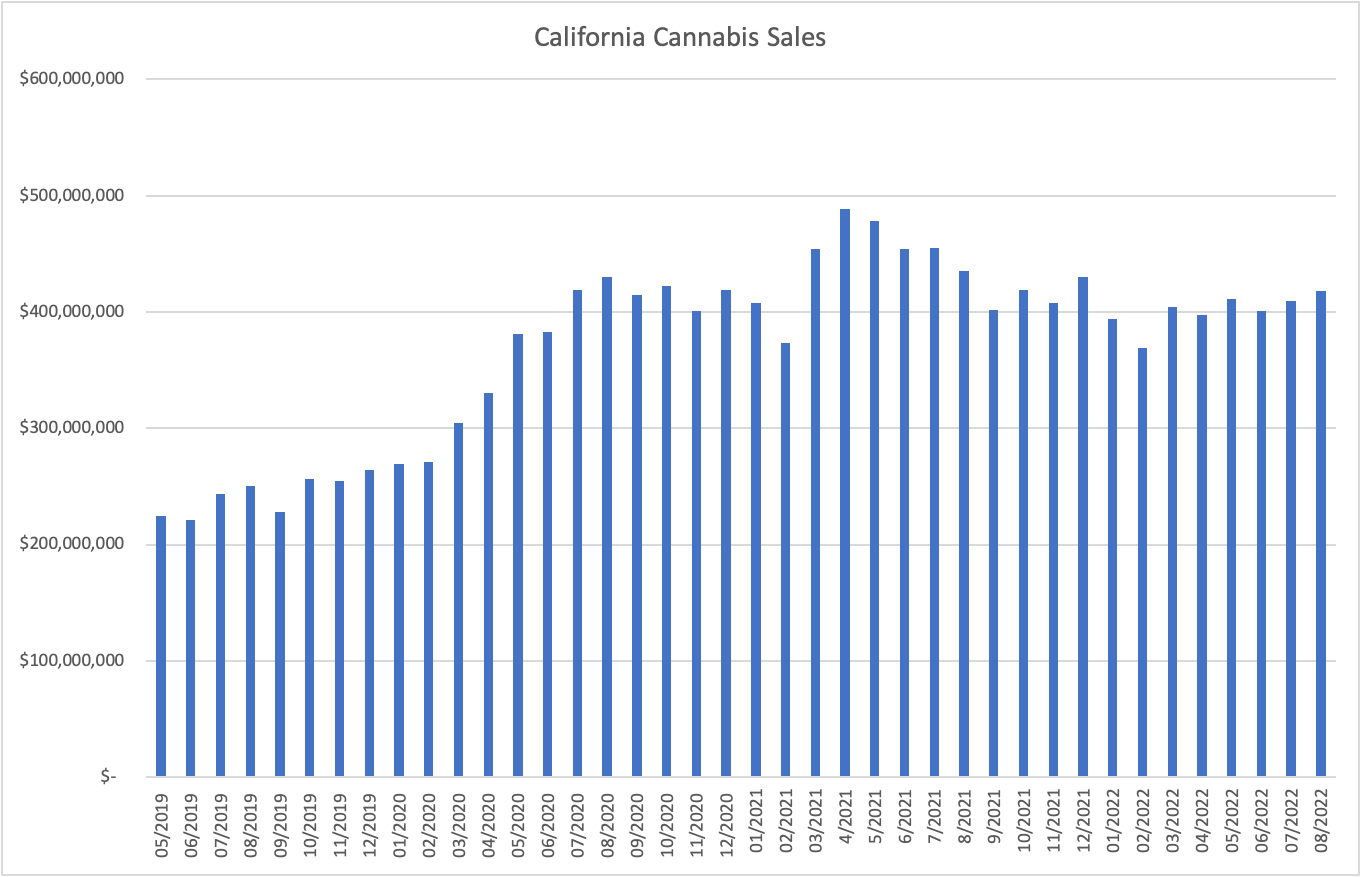
California
California sales increased 2.1% sequentially to $418.4 million and fell 3.8% compared to a year ago. Flower sales were down 13%, while pre-rolls grew 12%. Ingestibles gained 3% and concentrates fell 1% from a year ago during August.
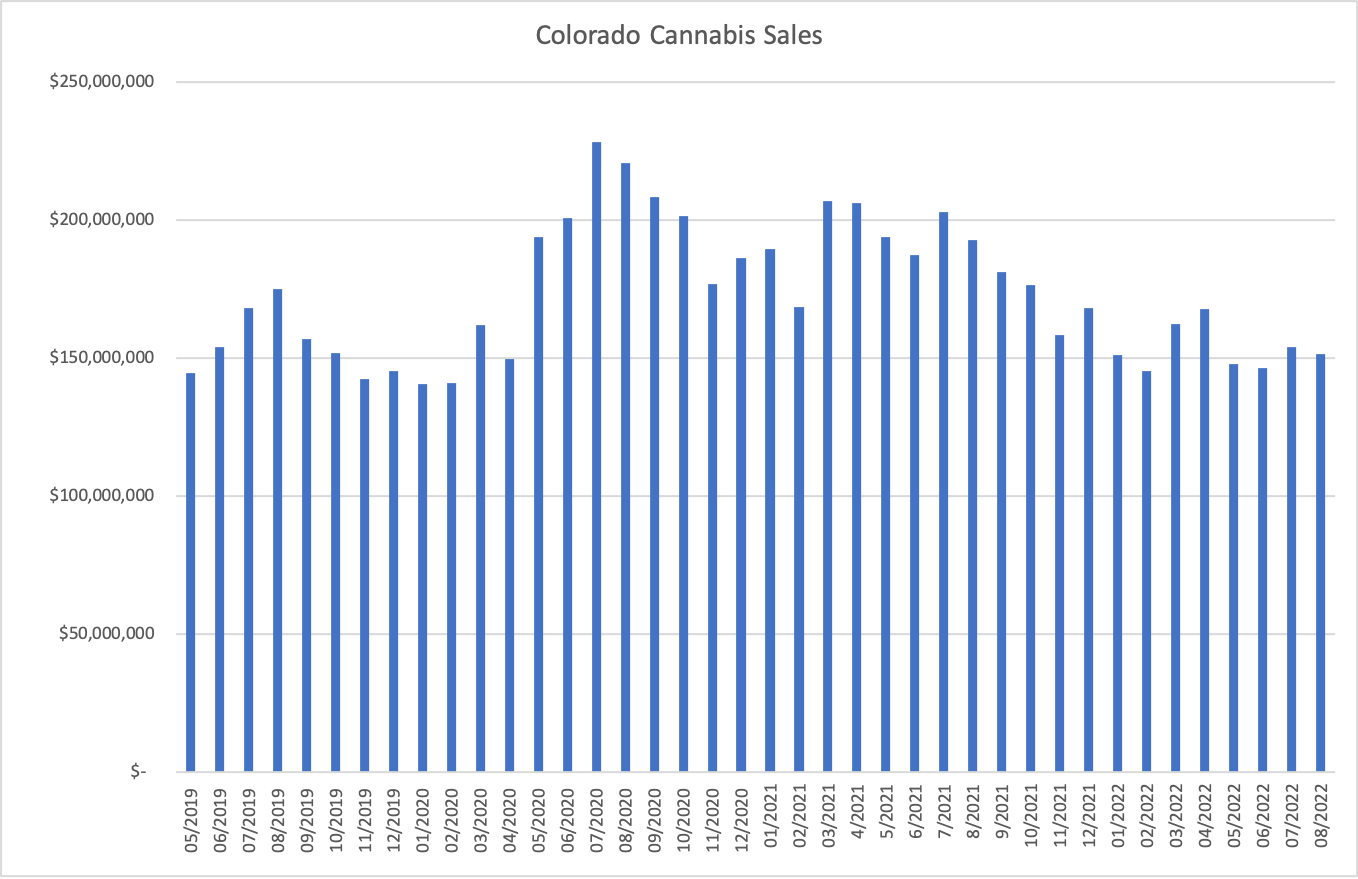
Colorado
Sales declined 1.6% in August compared to July, dropping 21.5% from a year ago to $151.4 million. Flower sales were down 25%, pre-rolls declined 16%, while concentrates fell 18%. Ingestibles declined 22% year-over-year.
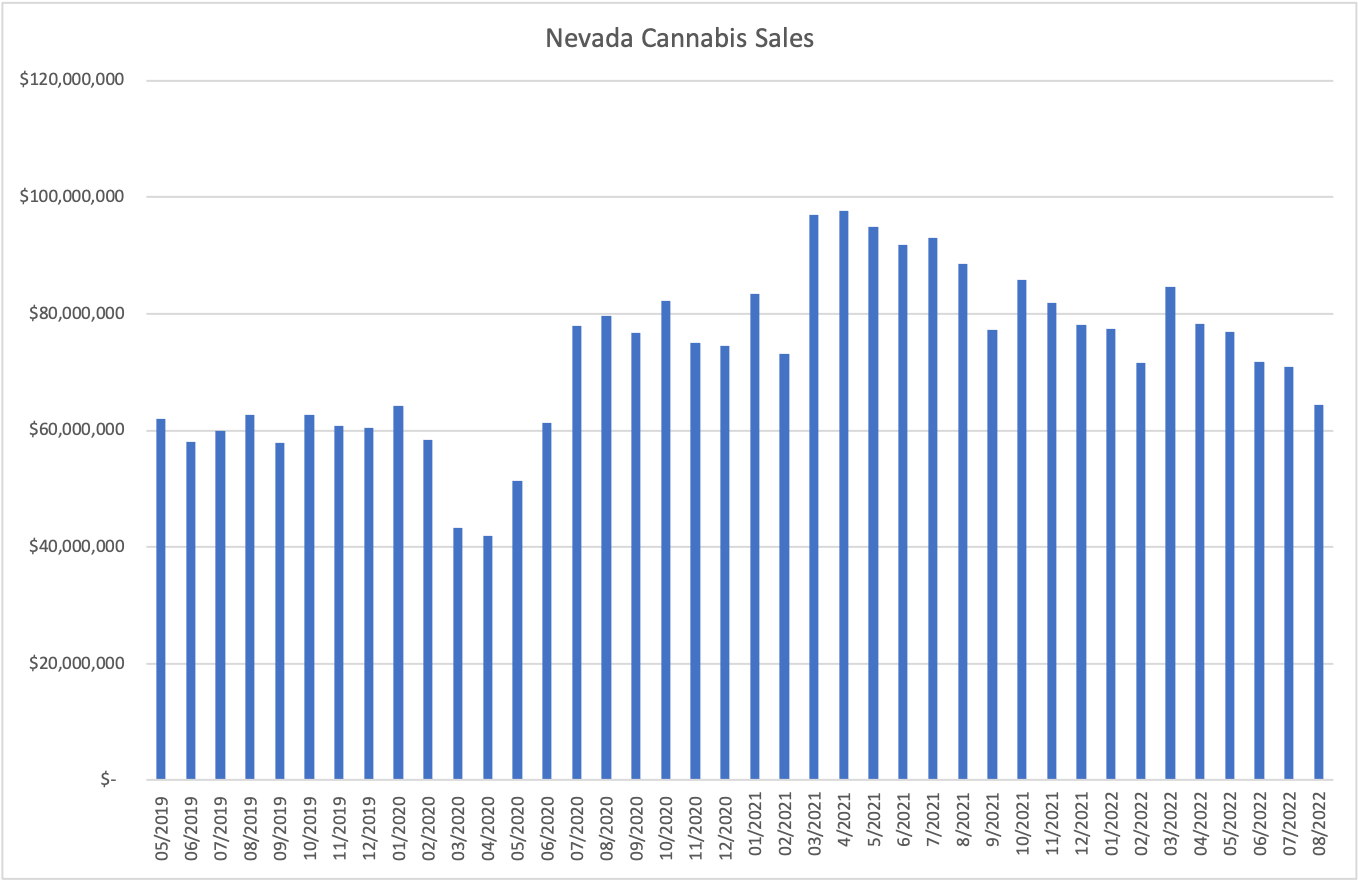
Nevada
The total size of the Nevada market was adjusted to align with the taxable sales figures published by the State of Nevada’s Department of Taxation from August 2019 onward. Sales decreased 9.2% sequentially, falling 27.2% from a year ago to $64.4 million. Flower sales dropped 35% from a year ago. Concentrates fell 15%, while ingestibles decreased 24% and pre-rolls declined 19%.
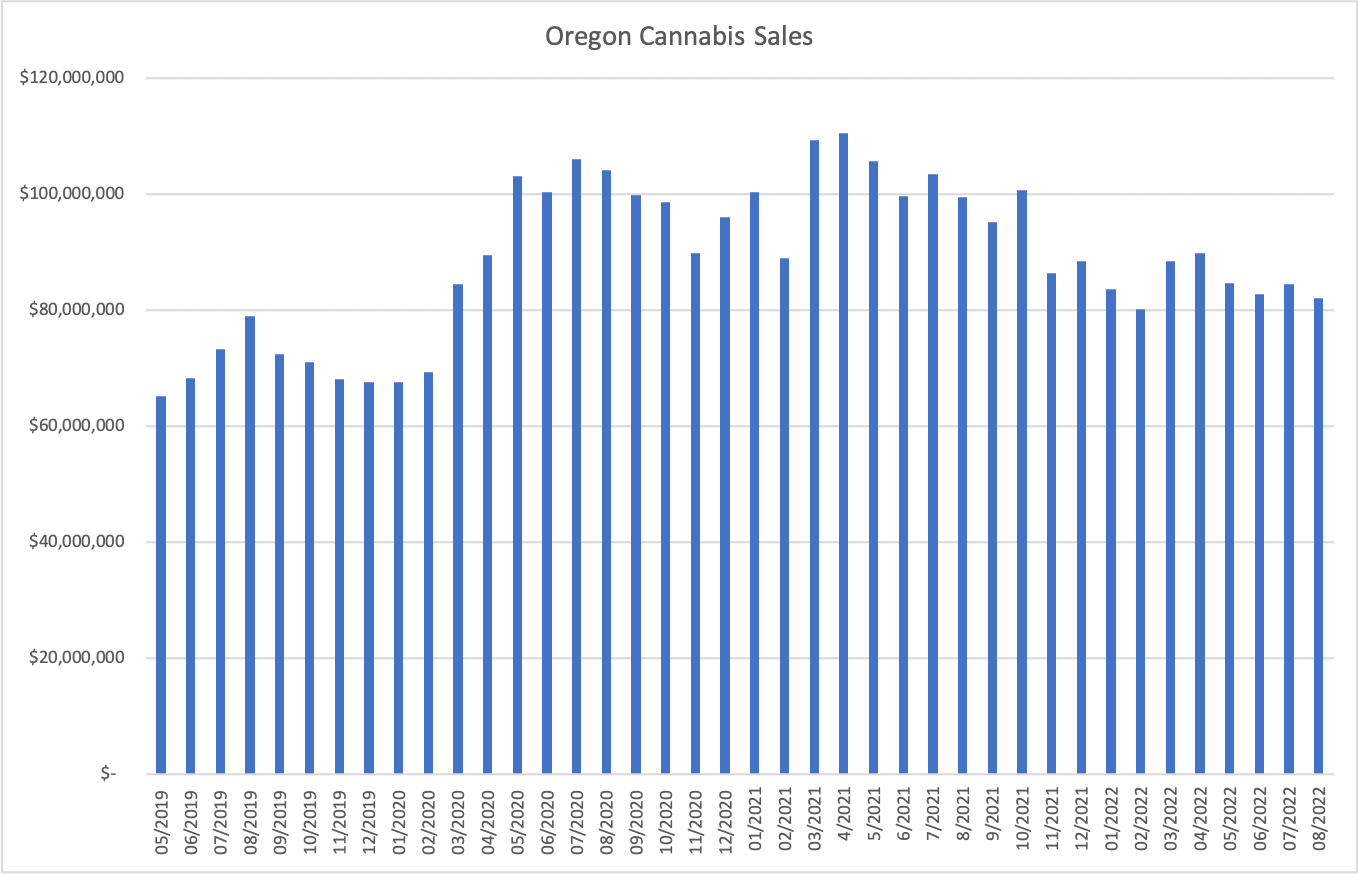
Oregon
Sales in August fell 2.7% from July to $82.2 million, down 17.4% from a year ago. Flower sales were down 29% year-over-year. Ingestibles were down 5%, while pre-rolls declined 4% and concentrates decreased 11%.
For readers interested in a deeper look at cannabis markets across these eleven states and more, including segmentation by additional product categories, brand and item detail, longer history, and segmentation by product attributes, learn how BDSA Solutions can provide you with unlimited access to the most accurate and actionable data and analysis.