![]()
Cronos Group Reports 2022 Fourth Quarter and Full-Year Results
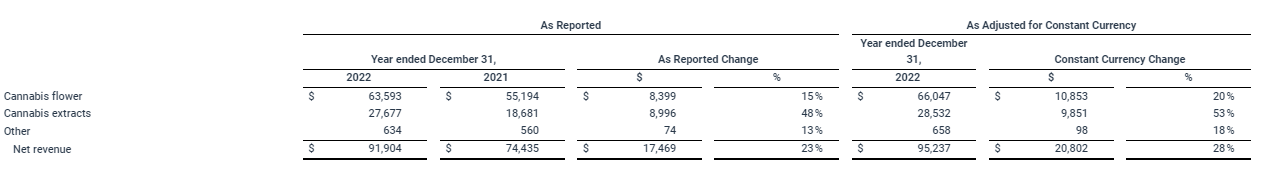
- Consolidated net revenue increased 23% in Full Year 2022 compared to Full Year 2021; on a constant currency basis consolidated net revenue increased 28% in Full Year 2022 compared to Full Year 2021
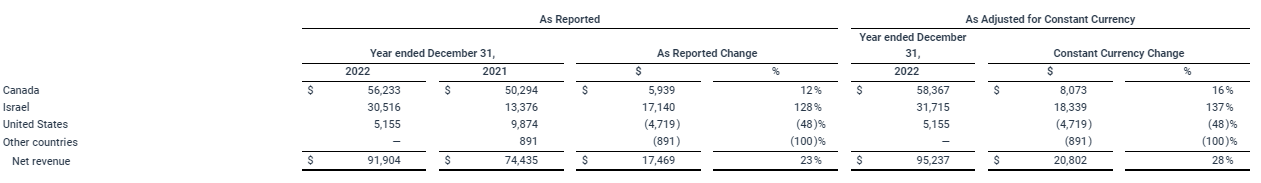
- Net revenue in Israel increased 128% in Full Year 2022 compared to Full Year 2021; on a constant currency basis net revenue in Israel increased 137% in Full Year 2022 compared to Full Year 2021
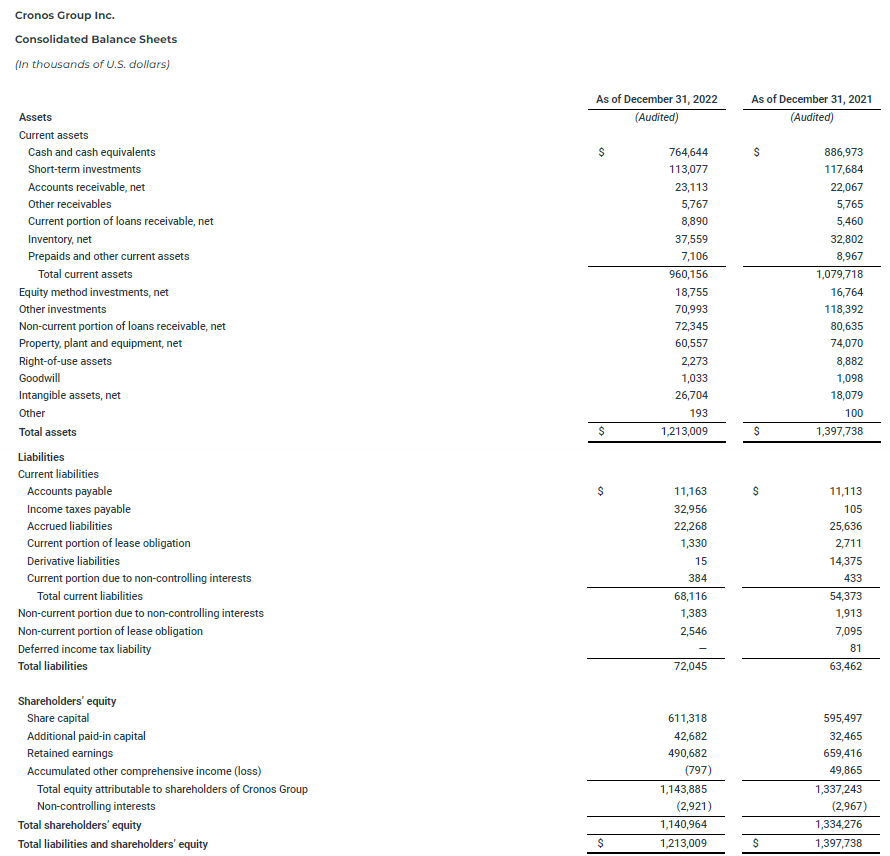
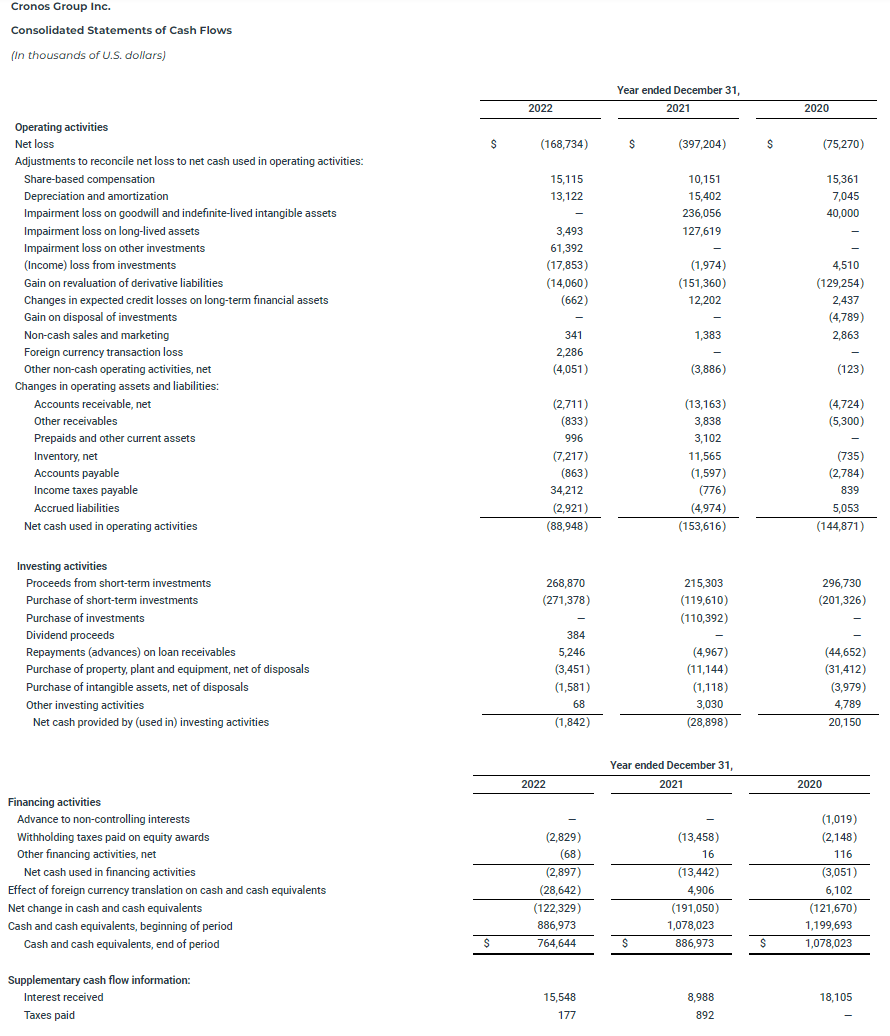
- Ended 2022 with $878 million in cash and short-term investments
- Spinach® became the number one edible brand in Canada in January 2023
TORONTO, Feb. 28, 2023 (GLOBE NEWSWIRE) — Cronos Group Inc. (NASDAQ: CRON) (TSX: CRON) (“Cronos” or the “Company”), today announces its 2022 fourth quarter and full-year business results.
2022 was a transformative year for Cronos in which we executed a business realignment, including a cost savings program, while staying laser focused on continuing to build our portfolio of borderless products.
 Mike Gorenstein, Chairman, President and CEO of Cronos.
We exceeded our originally stated goal by saving $28.7 million in operating expenses in 2022, to right-size our cost structure to be more adaptable to the changing landscape we face globally in the cannabis industry.
He added, “A significant amount of work went into building the Spinach® brand and creating the right products for it, which culminated in the brand achieving the number one market share in the Canadian edibles category in January 2023. This achievement was validation of our innovation capabilities and is encouraging as we prepare to further expand our portfolio of borderless products. Additionally, Peace Naturals® continues to be a leading medical cannabis brand in Israel, supported by our robust genetics portfolio, which is a testament to our capabilities in building iconic brands that resonate with consumers across the globe. Looking forward to 2023, we are excited about our product and innovation pipelines across categories and we look forward to bringing differentiated products to market that elevate the consumer experience.”
Financial Results
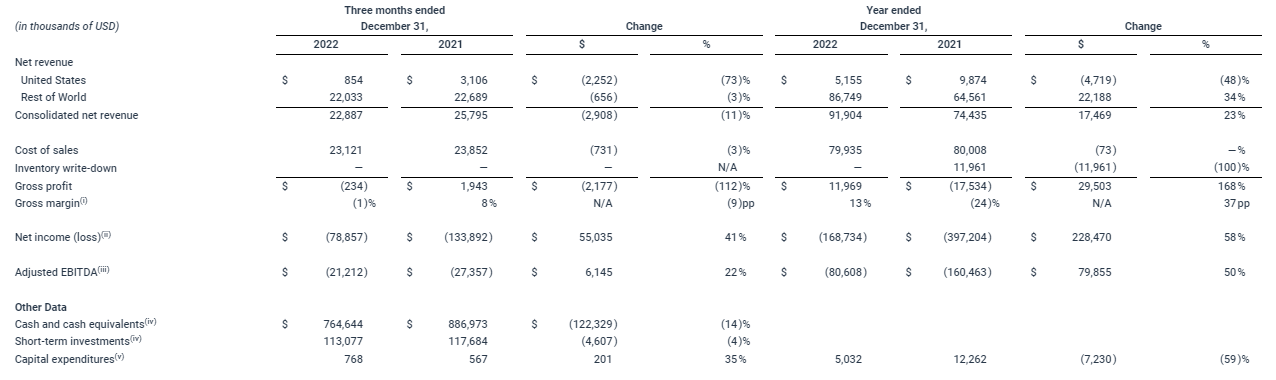
(i) Gross margin is defined as gross profit divided by net revenue.
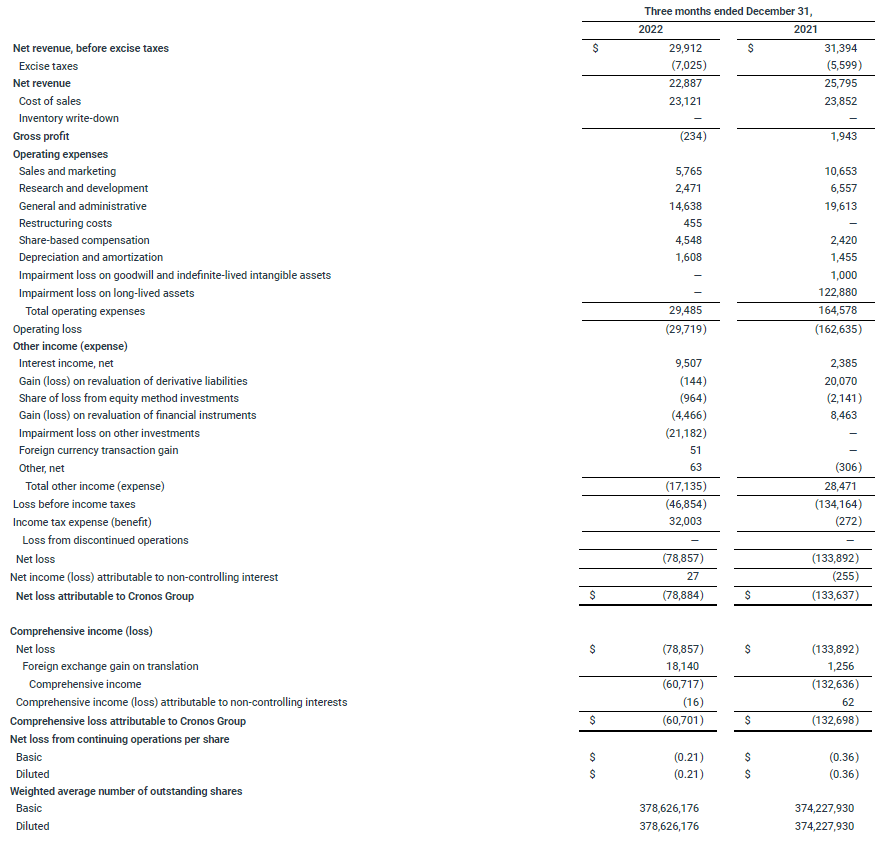
(ii) Net income (loss) of $(78.9) million in Q4 2022 improved by $55.0 million from Q4 2021. The improvement year-over-year was primarily driven by a $122.9 million impairment loss on long lived assets in Q4 2021 that did not occur in Q4 2022.
(iii) See “Non-GAAP Measures” for more information, including a reconciliation of adjusted earnings (loss) before interest, taxes, depreciation and amortization (“Adjusted EBITDA”) to net income (loss).
(iv) Dollar amounts are as of the last day of the period indicated.
(v) Capital expenditures represent component information of investing activities and is defined as the sum of purchase of property, plant and equipment, and purchase of intangible assets.
Fourth Quarter 2022
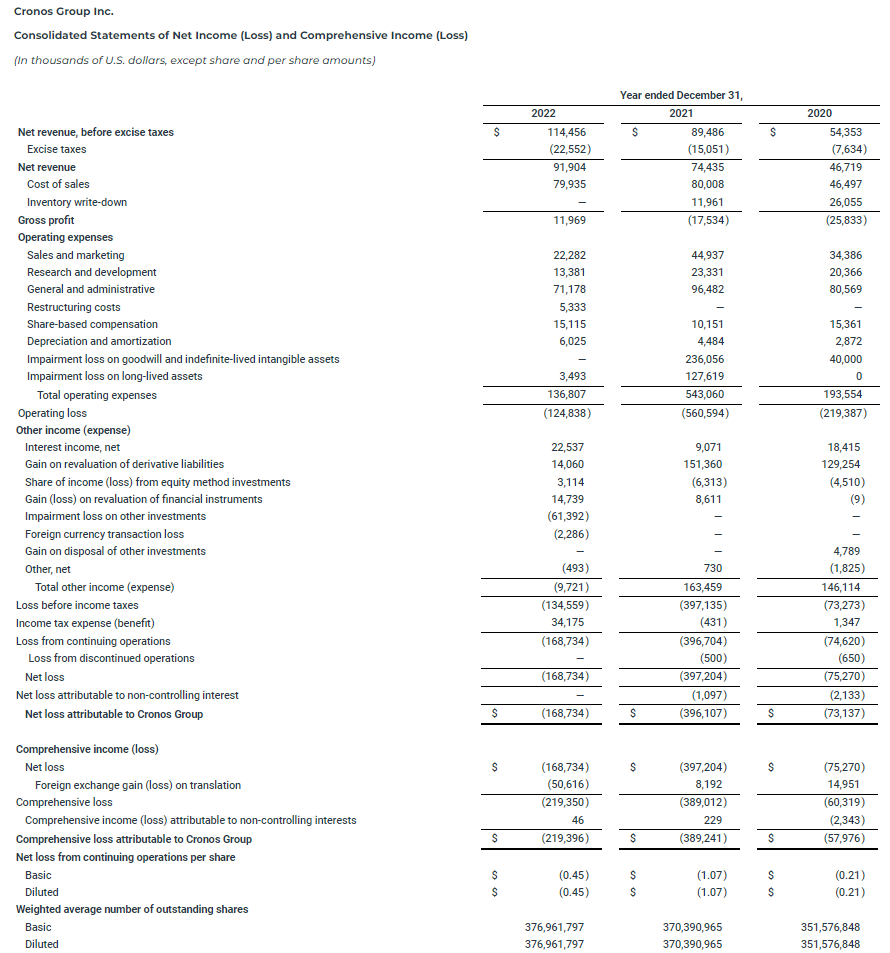
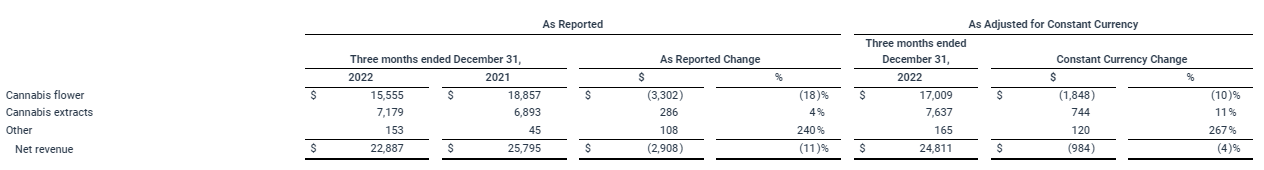
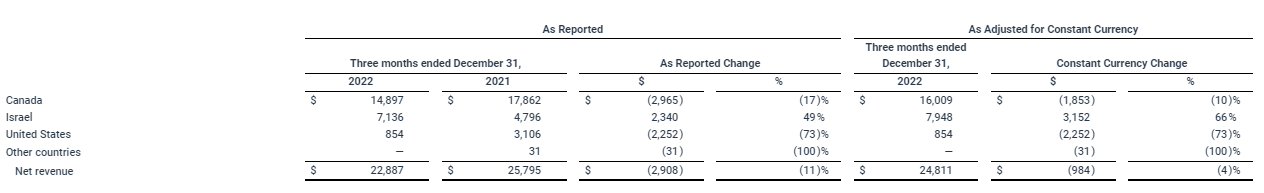
- Net revenue of $22.9 million in Q4 2022 decreased by $2.9 million from Q4 2021. The decrease year-over-year was primarily driven by lower cannabis flower sales in the Canadian adult-use market driven largely by adverse price/mix shift, lower sales in the U.S. segment and the impact of the weakening Canadian dollar against the U.S. dollar during the period, partially offset by an increase in net revenue in the Israeli medical market.
- Gross profit of $(0.2) million in Q4 2022 declined by $2.2 million from Q4 2021. The decline year-over-year was primarily driven by reduced gross profit in the Rest of World (“ROW”) segment, mainly driven by lower cannabis flower sales in Canada, increased inventory reserves in the U.S. segment as we transitioned away from beauty products, lower fixed cost absorption and packaging changes in the ROW segment, partially offset by increased sales of cannabis flower in Israel, a favorable mix of cannabis extract products that carry a higher margin profile than other product categories, and lower cannabis biomass costs.
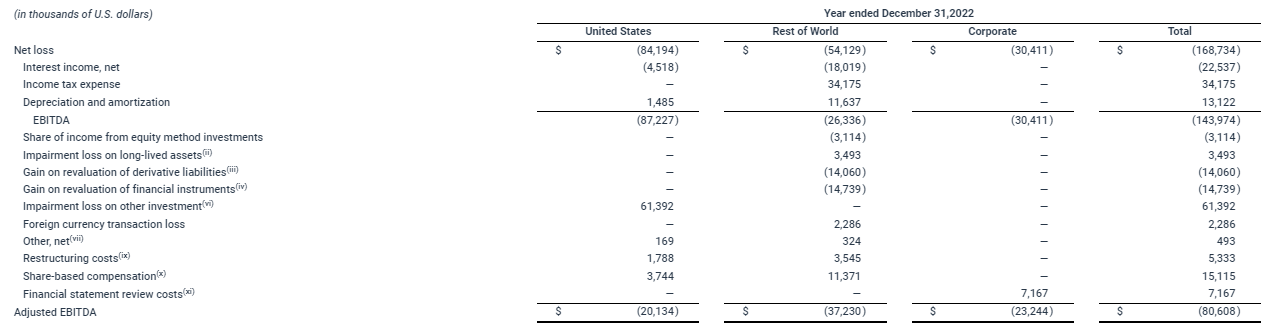
- Adjusted EBITDA of $(21.2) million in Q4 2022 improved by $6.1 million from Q4 2021. The improvement year-over-year was primarily driven by decreases in general and administrative expenses, sales and marketing expenses, and research and development expenses primarily as a result of the Company’s strategic realignment (the “Realignment”).
Full-Year 2022
- Net revenue of $91.9 million in Full-Year 2022 increased by $17.5 million from Full-Year 2021. The increase year-over-year was primarily driven by an increase in net revenue in the ROW segment driven by growth in the Israeli medical market and higher extract sales in the Canadian adult-use market, partially offset by a reduction in revenue in the U.S. segment, an adverse price/mix shift in the cannabis flower category in Canada and the impact of the weakened Canadian dollar against the U.S. dollar during the period.
- Gross profit of $12.0 million in Full-Year 2022 improved by $29.5 million from Full-Year 2021. The improvement year-over-year was primarily driven by increased revenue in the ROW segment, mainly driven by a favorable mix of cannabis extract products in Canada that carry a higher margin profile than other product categories, higher sales of cannabis flower in Israel, the absence of inventory write-downs in 2022 and lower cannabis biomass costs. The increases were partially offset by increased inventory reserves in the U.S. segment as we transitioned away from beauty products and lower fixed cost absorption.
- Adjusted EBITDA of $(80.6) million in Full-Year 2022 improved by $79.9 million from Full-Year 2021. The improvement year-over-year was primarily driven by an improvement in gross profit and decreases in general and administrative expenses, sales and marketing expenses, and research and development expenses primarily as a result of the Realignment.
Business Updates
Strategic and Organizational Update
In March 2022, following the evaluation of our global supply chain, we announced the planned exit of our Peace Naturals Campus. Cronos participates in an industry that is constantly evolving, so it is important for the Company to stay agile. To do that, the Company continues transitioning towards a more flexible footprint, ensuring we have the capabilities to execute in current and future market opportunities. To that end, Cronos has decided to maintain select components of its operations at the Peace Naturals Campus, namely distribution and warehousing, certain R&D activities and manufacturing of certain of the Company’s proprietary innovation products.
Following the $28.7 million in operating expense savings in 2022, we have identified an additional $10 to $20 million we anticipate saving across operating expense categories in 2023, primarily driven by savings in sales and marketing, general and administrative, and research and development.
Brand and Product Portfolio
In the fourth quarter of 2022 the Spinach® brand continued to organically expand market share in the edibles category in Canada. According to Hifyre data, Spinach® edibles held an approximate 15.9% market share, which expands to approximately 20.9% within the gummy category, during the fourth quarter of 2022. Furthermore, five SOURZ by Spinach® gummies ranked in the top-10 of all Canadian SKUs by market share. As of January 2023, Spinach® was the number one edible brand in Canada, according to Hifyre data.
In December 2022, the Company expanded its rare cannabinoid edible line-up under the Spinach FEELZ™ brand, with the introduction of a new CBC gummy, Spinach FEELZ™ Mango Lime 1:3 THC + CBC. These gummies are the first CBC gummy product in Canada and the first to feature a 1:3 ratio of THC to CBC.
Cronos revamped its vape portfolio in 2022, including the addition of 1-gram vapes, new and exciting flavors based off of well performing flower strains and multiple rare cannabinoid SKUs, including CBG and CBN. In the fourth quarter, Spinach® rose to be the number six vape brand, capturing 4.8% market share according to Hifyre data. This result was led by the best performing Spinach® product, the Blueberry Dynamite 1-gram vape.
In the fourth quarter of 2022, Cronos continued to innovate and improve its pre-roll and flower portfolio under the Spinach® brand with the launch of new and exciting high potency strains in Canada. Cronos launched two new strains across various formats: Kiwi Lime Punch and Green Monster Breath.
In Israel, we continue to execute by growing brand awareness with PEACE NATURALS®. Cronos is focused on continuing to bring new and exciting cannabis flower strains powered by our genetic breeding program to the Israeli medical market, such as Cocoa Bomba and Miami Sky.
Intellectual Property Initiatives
In November and December 2022, Cronos achieved equity milestones for cannabichromenic acid (“CBCA”) and cannabichromevarinic acid (“CBCVA”), respectively, under its strategic partnership (the “Ginkgo Strategic Partnership”) with Ginkgo Bioworks Holdings, Inc. (NYSE:DNA) (“Ginkgo”). The Company is pleased to have achieved milestones for three rare cannabinoids through the fermentation process in 2022.
Global Supply Chain
Cronos Growing Company Inc. (“Cronos GrowCo”) reported to the Company preliminary unaudited net revenue to licensed producers excluding sales to the Company in the fourth quarter and full-year 2022 of approximately $2.4 million and $21.0 million, respectively. GrowCo’s performance on cultivation continues to be strong, hitting north of 30% THC potency on recent harvests, which is a testament to our joint venture’s complementary capabilities in cultivation and downstream processing and the Company’s investment in genetic breeding and tissue culture. The Company’s 50% share of GrowCo’s net income, which is accounted for under the equity method of accounting, equated to $3.1 million in 2022. Cronos previously provided GrowCo with a credit facility, which currently has approximately $73.8 million outstanding following the repayment of principal of $3.1 million by GrowCo as of December 2022. In addition to principal repayment, Cronos also received $2.2 million in interest payments from GrowCo in 2022, which totals approximately $5.2 million in cash payments to Cronos in 2022.
Appointments
In November 2022, Cronos appointed James Holm as Chief Financial Officer after nearly two decades of finance and accounting experience at leading companies across industries. He most recently served as the Global Vice President of Finance Transformation at Vertiv, a global provider of critical digital infrastructure and continuity solutions, where he led the company’s centralization, standardization and optimization to a Global Shared Service hub for finance processes. Before joining Vertiv, Mr. Holm served as Finance Leader, Finance Solutions & Process Transformation Organization at Worldpay, one of the largest global payment processors. There he drove financial reporting accuracy, capabilities and enhancements across the company. Earlier in his career, he held multiple positions of increasing seniority in the finance department during his eight-year tenure at Procter and Gamble.
Rest of World Results
Cronos’ ROW reporting segment includes results of the Company’s operations for all markets outside of the U.S.
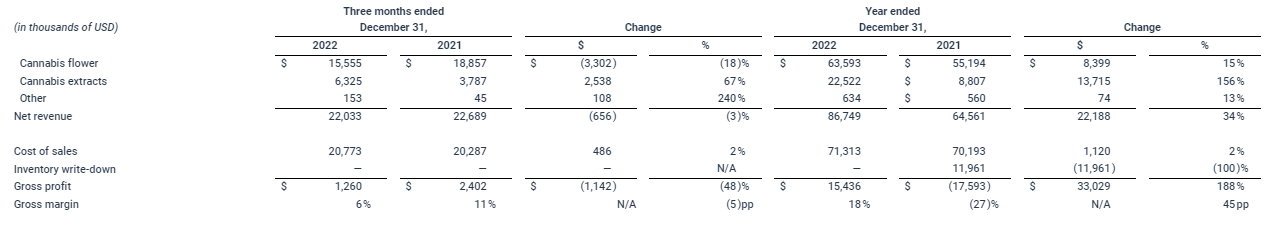
Fourth Quarter 2022
- Net revenue of $22.0 million in Q4 2022 decreased by $0.7 million from Q4 2021. The decrease year-over-year was primarily driven by a decrease in cannabis flower revenue in Canada driven by adverse price/mix shift and the impact of the weakened Canadian dollar against the U.S. dollar during the period, partially offset by higher cannabis extract sales in Canada and cannabis flower sales in Israel.
- Gross profit of $1.3 million in Q4 2022 declined by $1.1 million from Q4 2021. The decline year-over-year was primarily driven by lower fixed absorption and packaging changes, partially offset by increased cannabis flower revenue in Israel, and higher cannabis extract sales in Canada, which carry a higher gross margin than other product categories, and lower cannabis biomass costs.
Full-Year 2022
- Net revenue of $86.7 million in Full-Year 2022 increased by $22.2 million from Full-Year 2021. The increase year-over-year was primarily driven by growth in cannabis flower revenue in the Israeli medical market and higher cannabis extract sales in the Canadian adult-use market, partially offset by lower cannabis flower sales in Canada driven by an adverse price/mix shift and the impact of the weakened Canadian dollar against the U.S. dollar during the period.
- Gross profit of $15.4 million in Full-Year 2022 improved by $33.0 million from Full-Year 2021. The improvement year-over-year was primarily driven by increased cannabis flower revenue in Israel, and higher cannabis extract sales in Canada, which carry a higher gross margin than other product categories, the absence of inventory write-downs in 2022 and lower cannabis biomass costs. The improvements were partially offset by lower fixed cost absorption.
United States Results
Cronos’ U.S. reporting segment includes results of the Company’s operations for all brands and products in the U.S.
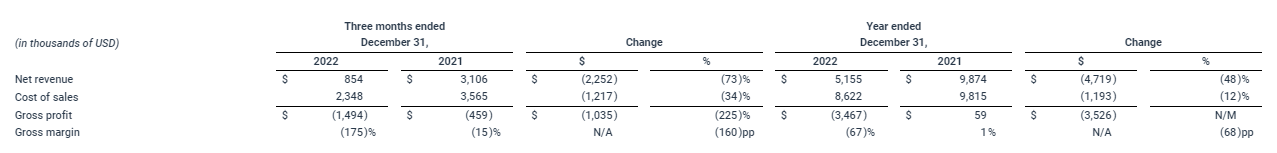
Fourth Quarter 2022
- Net revenue of $0.9 million in Q4 2022 decreased by $2.3 million from Q4 2021. The decrease year-over-year was primarily driven by a reduction in sales as a result of a decrease in promotional spending and SKU rationalization efforts as the Company implemented the Realignment with respect to the U.S. segment.
- Gross profit of $(1.5) million in Q4 2022 decreased by $1.0 million from Q4 2021. The decrease year-over-year was primarily due to lower sales volumes and increased inventory reserves associated with discontinued products as we transition away from beauty products and focus on adult-use product formats.
Full-Year 2022
- Net revenue of $5.2 million in Full-Year 2022 decreased by $4.7 million from Full-Year 2021. The decrease year-over-year was primarily due to a decrease in promotional spending and SKU rationalization efforts as the Company implemented the Realignment with respect to the U.S. segment.
- Gross profit of $(3.5) million in Full-Year 2022 decreased by $3.5 million from Full-Year 2021. The decrease year-over-year was primarily due to lower sales volumes and increased inventory reserves associated with discontinued products as we transition away from beauty products and focus on adult-use product formats.
Conference Call
The Company will host a conference call and live audio webcast on Tuesday, February 28, 2023, at 8:30 a.m. ET to discuss 2022 Fourth Quarter and Full-Year business results. An audio replay of the call will be archived on the Company’s website for replay. Instructions for the live audio webcast are provided on the Company’s website at: https://ir.thecronosgroup.com/events-presentations.
About Cronos
Cronos is an innovative global cannabinoid company committed to building disruptive intellectual property by advancing cannabis research, technology and product development. With a passion to responsibly elevate the consumer experience, Cronos is building an iconic brand portfolio. Cronos’ diverse international brand portfolio includes Spinach®, PEACE NATURALS® and Lord Jones®. For more information about Cronos and its brands, please visit: thecronosgroup.com.
Non-GAAP Measures
Cronos reports its financial results in accordance with Generally Accepted Accounting Principles in the United States (“U.S. GAAP”). This press release refers to measures not recognized under U.S. GAAP (“non-GAAP measures”). These non-GAAP measures do not have a standardized meaning prescribed by U.S. GAAP and are therefore unlikely to be comparable to similar measures presented by other companies. Rather, these non-GAAP measures are provided as a supplement to corresponding U.S. GAAP measures to provide additional information regarding the results of operations from management’s perspective. Accordingly, non-GAAP measures should not be considered a substitute for, or superior to, the financial information prepared and presented in accordance with U.S. GAAP. All non-GAAP measures presented in this press release are reconciled to their closest reported U.S. GAAP measure. Reconciliations of historical adjusted financial measures to corresponding U.S. GAAP measures are provided below.
Adjusted EBITDA
Management reviews Adjusted EBITDA, a non-GAAP measure which excludes non-cash items and items that do not reflect management’s assessment of ongoing business performance of our operating segments. Management defines Adjusted EBITDA as net income (loss) before interest, tax expense (benefit), depreciation and amortization adjusted for: share of income (loss) from equity method investments; impairment loss on goodwill and intangible assets; impairment loss on long-lived assets; (gain) loss on revaluation of derivative liabilities; (gain) loss on revaluation of financial instruments; transaction costs related to strategic projects; impairment loss on other investments; foreign currency transaction loss; other, net; loss from discontinued operations; restructuring costs; share-based compensation; and financial statement review costs and reserves related to the restatements of the Company’s 2019 and 2021 interim financial statements (the “Restatements”), including the costs related to the settlement of the SEC’s and the OSC’s investigations of the Restatements and legal costs defending shareholder class action complaints brought against the Company as a result of the 2019 restatement.
Management believes that Adjusted EBITDA provides the most useful insight into underlying business trends and results and provides a more meaningful comparison of period-over-period results. Management uses Adjusted EBITDA for planning, forecasting and evaluating business and financial performance, including allocating resources and evaluating results relative to employee compensation targets.
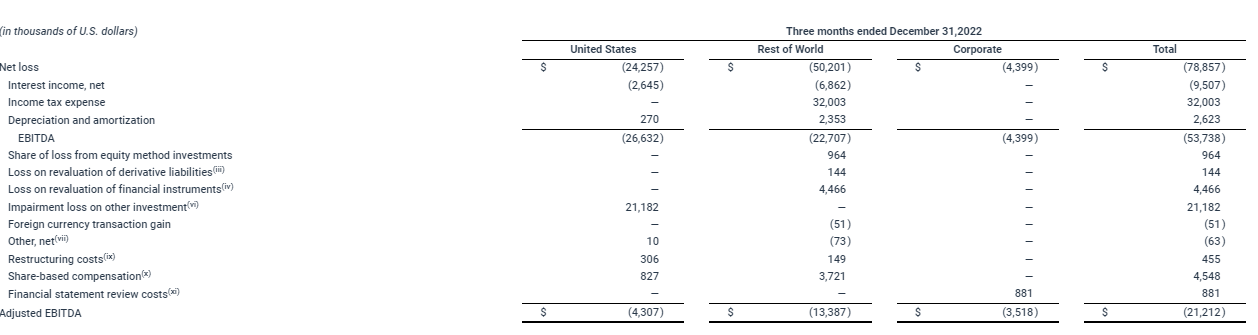
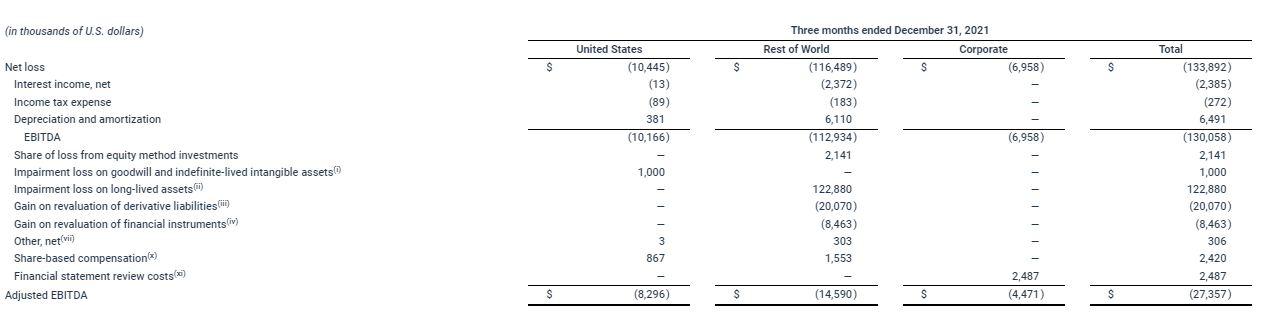
The following tables set forth a reconciliation of Net income (loss) as determined in accordance with U.S. GAAP to Adjusted EBITDA for the periods indicated:
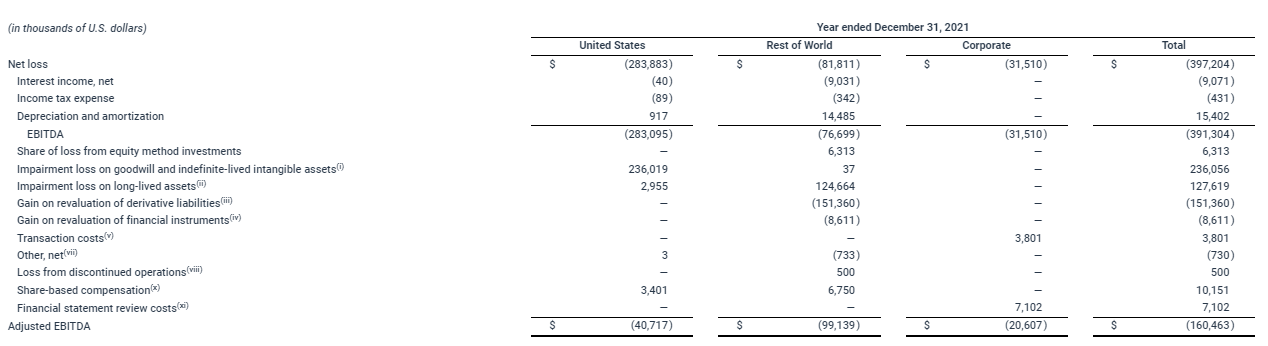
(i) For the three months and year ended December 31, 2021, impairment loss on goodwill and indefinite-lived intangible assets relates to impairment on goodwill and intangible assets related to our U.S. segment and impairment on an indefinite-lived trademark related to the ROW segment.
(ii) For the year ended December 31, 2022, impairment loss on long-lived assets related to the Company’s decision to seek a sublease for leased office space in Toronto, Ontario, Canada during the first quarter of 2022. For the three months ended December 31, 2021, impairment loss on long-lived assets relates impairment to an impairment on property, plant and equipment in the U.S. segment. For the three months ended December 31, 2021, impairment loss on long-lived assets relates to impairment charges on property, plant and equipment and definite-lived intangible assets in the Canadian asset group, impairment charges for the differences between the consideration paid to Ginkgo for the achievement of two equity milestones in connection with the Ginkgo Collaboration Agreement and the fair values of the exclusive licenses for CBGA and for CBGVA. For the year ended December 31, 2021, impairment loss on long-lived assets relates to the aforementioned impairment charges related to the Canadian asset group and impairments on the two Ginkgo equity milestones as well as impairment on leased premises in the U.S. segment.
(iii) For the three months and years ended December 31, 2022 and 2021, (gain) loss on revaluation of derivative liabilities represents the fair value changes on the derivative liabilities.
(iv) For the three months and year ended December 31, 2022, (gain) loss on revaluation of financial instruments related primarily to the Company’s equity securities in Vitura. For the three months and year ended December 31, 2021, gain on revaluation of financial instruments related primarily to revaluations of financial liabilities resulting from the Company’s deferred share units.
(v) For the year ended December 31, 2021, transaction costs represent legal, financial and other advisory fees and expenses incurred in connection with various strategic investments. These costs are included in general and administrative expenses on the condensed consolidated statements of net income (loss) and comprehensive income (loss).
(vi) For the three months and year ended December 31, 2022, impairment loss on other investments related to the PharmaCann Option for the difference between its fair value and carrying amount.
(vii) For the year ended December 31, 2022, other, net primarily related to $646 loss on disposal of assets and $390 of dividends declared by Vitura on the Company’s 55,176,065 ordinary shares in the capital of Vitura. For the three months and year ended December 31, 2021, other, net is primarily related to (gain) loss on reclassification of held-for-sale assets and (gain) loss on disposal of assets.
(viii) For the year ended December 31, 2021, loss from discontinued operations relates to the discontinuance of Original B.C. Ltd.
(ix) For the three months and year ended December 31, 2022, restructuring costs related to the employee-related severance costs and other restructuring costs associated with the Realignment, change in the nature of operations at the Peace Naturals Campus.
(x) For the three months and years ended December 31, 2022 and 2021, share-based compensation related to the vesting expenses of share-based compensation awarded to employees under the Company’s share-based award plans.
(xi) For the three months and years ended December 31, 2022 and 2021, financial statement review costs include costs related to the restatements of the Company’s 2019 interim financial statements and second quarter 2021 interim financial statements, costs related to the Company’s responses to requests for information from various regulatory authorities relating to such restatements, the costs related to the Settlement Order and Settlement Agreement and legal costs defending shareholder class action complaints brought against the Company as a result of the 2021 and 2019 restatements.
Constant Currency
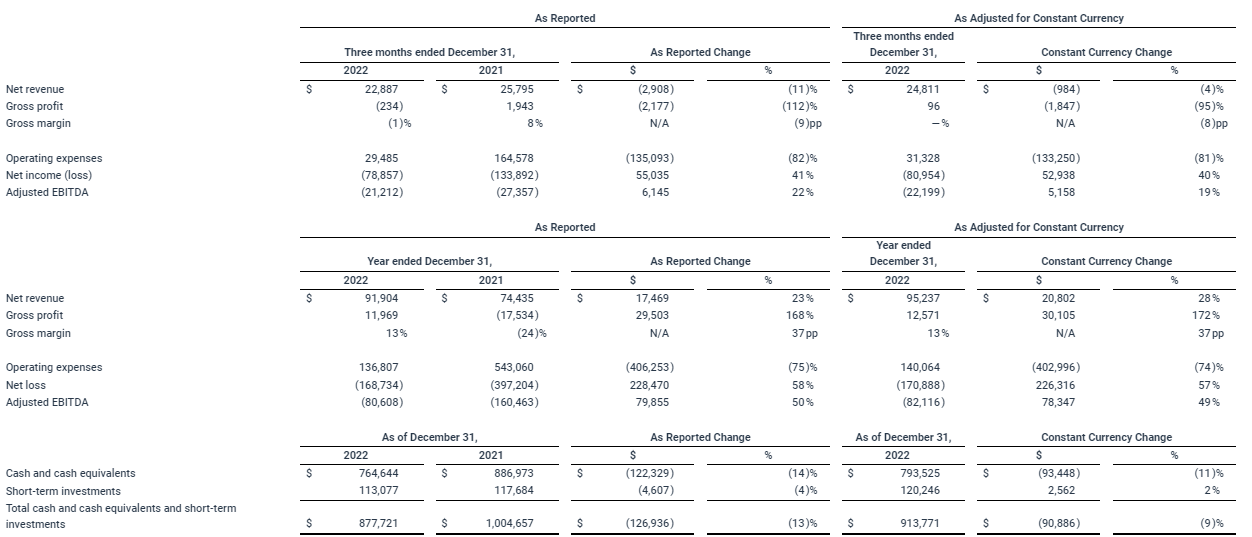
To supplement the consolidated financial statements presented in accordance with U.S. GAAP, we have presented constant currency adjusted financial measures for net revenues, gross profit, gross profit margin, operating expenses, net income (loss) and adjusted EBITDA for the three months and years ended December 31, 2022 as well as cash and cash equivalents and short-term investment balances as of December 31, 2022 compared to December 31, 2021, which are considered non-GAAP financial measures. We present constant currency information to provide a framework for assessing how our underlying operations performed excluding the effect of foreign currency rate fluctuations. To present this information, current and comparative prior period income statement results in currencies other than U.S. dollars are converted into U.S. dollars using the average exchange rates from the three-month and annual comparative periods in 2021 rather than the actual average exchange rates in effect during the respective current periods; constant currency current and prior comparative balance sheet information is translated at the prior year-end spot rate rather than the current period spot rate. All growth comparisons relate to the corresponding period in 2021. We have provided this non-GAAP financial information to aid investors in better understanding the performance of our segments. The non-GAAP financial measures presented in this press release should not be considered as a substitute for, or superior to, the measures of financial performance prepared in accordance with U.S. GAAP.
The table below sets forth certain measures of consolidated results from continuing operations on a constant currency basis for the three months and years ended December 31, 2022 compared to the three months and years ended December 31, 2021 as well as cash and cash equivalents and short-term investments as of December 31, 2022 and December 31, 2021, both on an as-reported and constant currency basis (in thousands):
Net revenue
Foreign currency exchange rates
All currency amounts in this press release are stated in U.S. dollars (“USD”), which is our reporting currency, unless otherwise noted. All references to “dollars” or “$” are to USD. The assets and liabilities of the Company’s foreign operations are translated into USD at the exchange rate in effect as of December 31, 2022, December 31, 2021 and December 31, 2020. Transactions affecting shareholders’ equity are translated at historical foreign exchange rates. The consolidated statements of net income (loss) and comprehensive income (loss) and the consolidated statements of cash flows of the Company’s foreign operations are translated into USD by applying the average foreign exchange rate in effect for the reporting period using Bloomberg.
The exchange rates used to translate from USD to Canadian dollars (“C$”) is shown below: