![]()
GrowGeneration Reports Record 3rd Quarter Revenue
DENVER, Nov. 9, 2018 /PRNewswire/ – GrowGeneration Corp. (OTCQX: GRWG), (“GrowGen” or the “Company”) one of the largest specialty retail hydroponic and organic gardening stores, selling to both the commercial and home cannabis markets, with currently 18 locations, today reported financial results for its 3rd quarter ended September 30, 2018.
3rd Quarter 2018 Financial Highlights:
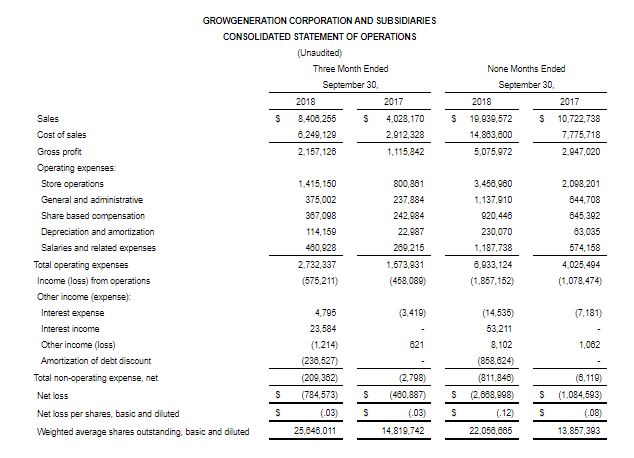
- Revenue of $8.4 million, up 109%, compared to revenue of $4.0 million for the 3rd quarter of 2017
- Store operating costs, as a percentage of revenue, have declined 16% from 19.9% for the 3rd quarter 2017 to 16.8% for the 3rd quarter of 2018
- YTD revenue of $20 million, up 86% compare to YTD revenue of $10.7 million for 2017
- YTD store operating costs, as a percentage of revenue, have declined from 19.6% for the nine months ended September 30, 2017 to 17.3% for the nine months ended September 30, 2018
- Adjusted EBITDA ($71,000) for the 3rd quarter 2018 compared to ($191,000) for the 3rd quarter 2017
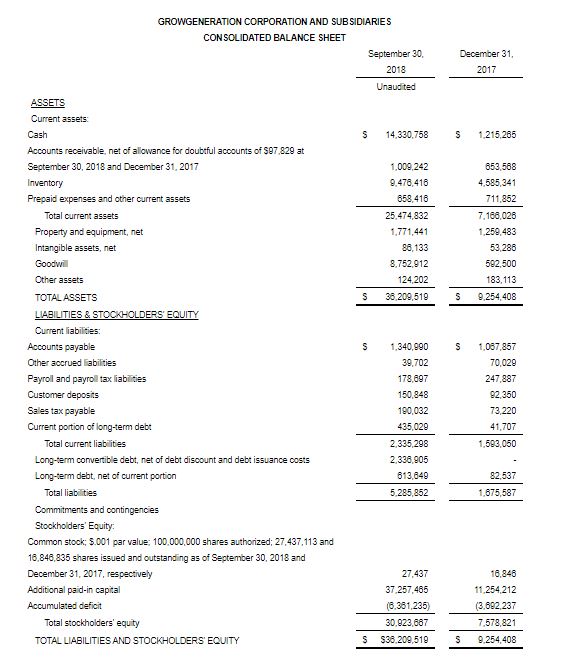
- The Company had $14.3 million in cash and cash equivalents at September 30, 2018
- As of September 30, 2018, the Company had total assets of $36.2 million compared to total assets of $9.2 million at December 31, 2017
- As of September 30, 2018, the Company had working capital of $23.1 million compared to working capital of $5.6 million at December 31, 2017
- The Company raised approximately $12.5 million in equity capital through the issuance of common stock and the exercise of warrants and $9.0 million in convertible debt financing for the nine-month period ended September 30, 2018
- Three new stores acquired in Q3 2018, one of which was our new e-commerce site, HeavyGardens.com
- Formed GrowGeneration Canada Corp.
- Formed GrowGeneration Hemp Corp.
- Revenue run rate guidance in excess of $42 million heading into 2019, $10.0 million for Q4 2018
This was another great quarter of growth for GrowGeneration, with revenues growing over 100% quarter over quarter. Our management teams focus on probability was clearly demonstrated with our operating costs being reduced by 16% in the quarter.
 Darren Lampert, Co-Founder and CEO
Our balance sheet, with assets totaling $36.0 million, $14.0 million in cash, well-positions the Company to continue to execute its acquisition plan and begin the process to up list the company to a larger exchange.
“Our acquisition of HeavyGardens.com sets our e-commerce strategy to offer an omni-channel shopping experience for all of our customers. Further, the formation of GrowGen Canada and GrowGen Hemp Corp demonstrates our commitment to unleash growth from all emerging markets in our industry. As reported, we are forecasting a revenue run rate of approximately $42 million coming out of 2018 and $10 million for Q4 2018.”
3rd Quarter 2018 Financial Results:
Net revenue for the three months ended September 30, 2018 increased approximately $4.4 million, or 109%, to approximately $8.4 million, compared to approximately $4.0 million for the three months ended September 30, 2017. The increase in revenues in 2018 was primarily due to the addition of 8 new stores opened or acquired after September 30, 2017, and the new e-commerce site acquired in mid-September 2018. The 8 new stores and the new e-commerce site contributed $4.9 million in revenue for the quarter ended September 30, 2018.
The Company continues to focus on the seven markets and the new e-commerce site noted below and the growth opportunities that exist in each market. We are also focusing on new store acquisitions, proprietary products and on developing our online and Amazon sales which we expect to contribute more to sales in the fourth quarter of 2018.
Sales of the Company’s products in the Colorado market declined $17,249 or less that 1% comparing the quarter ended September 30, 2018 to September 30, 2017 and is primarily due to store consolidations and the Company’s focus on operating larger more profitable stores. Sales of the Company’s products in the California market have seen growth of approximately $2.6 million from the addition of four (4) new stores through acquisitions, offset by a decline in revenues in our Santa Rosa store of approximately $281,000. The California market experienced slower growth in the prior and current quarters as a result of a change in the regulatory environment and the implementation of new rules and regulations which have slowed the issuance of new licenses. However, the Company is positioned to grow as new licenses are issued. Sales in our Santa Rosa store decreased $281,000 or 40% comparing the quarter ended September 30, 2018 to the quarter ended September 30, 2017. Our San Bernardino store increased by 148%, or $200,000, comparing the quarter ended September 30, 2018 to the quarter ended September 30, 2017. We attribute this gain to the Southern CA issuances of licenses in the Riverside County. With the recent acquisition of Santa Rosa Hydro in July 2018, one of the country’s largest hydroponic stores, the Company projects to add an incremental $8.0 million in sales in the Santa Rosa market.
The recognition of revenue in the Rhode Island and Michigan markets are the result of these new acquisitions in 2018 for which there was no comparable revenue in 2017. The Company is pursuing new store acquisitions in both of these markets and believes that these markets will be growth markets in the fourth quarter of 2018.
Although revenues in the Nevada market had a slight decline, $22,000, comparing the quarter ended September 30, 2018 to quarter ended September 30, 2017, the decline in revenue was attributable to large one-time sales to a commercial customer during the quarter ended September 30, 2017 related to this customer’s initial buildout of their commercial grow facility.
Sales in the Washington market had a slight decrease in revenue of $14,000 comparing the quarter ended September 30, 2018 to the quarter ended September 30, 2017.
The Company had the same 9 stores opened for the entire three months ended September 30, 2018 and 2017, five (5) in Colorado, two (2) in California, One (1) in Nevada, and one (1) in Washington. These same stores generated $3.3 million in sales for the three months ended September 30, 2018, compared to $3.4 million in sales for the same period ended September 30, 2017, a decrease of 4%. With regard to same store sales, our revenue in the Colorado market has declined comparing the three months ended September 30, 2018 to the three months ended September 30, 2017 by approximately $17,000 or approximately 1% primarily due to the loss of customers when we consolidated locations in the first quarter of 2018. While there was a loss of some revenue from customers where stores were consolidated, all operating costs were eliminated from the store that was closed and consolidated into another store location. Revenue in the California market declined by approximately $81,000 or 10% primarily due to the large fires in the Santa Rosa area in October 2017 which closed our store for 17 days due to mandatory evacuations. The Santa Rosa fires also impacted our commercial customer base and revenues in the Santa Rosa area have not returned to their pre-October 2017 revenue levels. The Washington market has a slight decline of revenues of approximately $14,000 of 6%. With regard to the Nevada market, the decline in revenue of $22,000 or 4% was attributable to large one-time sales to a commercial customer during the quarter ended September 30, 2017 related to this customer’s initial buildout of their commercial grow facility
Cost of Goods Sold
Cost of goods sold for the three months ended September 30, 2018 increased approximately $3.3 million, or 115%, to approximately $6.2 million, as compared to approximately $2.9 million for the three months ended September 30, 2017. The increase in cost of goods sold was primarily due to the 109% increase in sales comparing the three months ended September 30, 2018 to the three months ended September 30, 2017. The increase in cost of goods sold is directly attributable to the increase in the number of stores as discussed above.
Gross profit was approximately $2.2 million for the three months ended September 30, 2018, compared to approximately $1.1 million for the three months ended September 30, 2017, an increase of approximately $1.1 or 100%. Gross profit as a percentage of sales was 25.7% for the three months ended September 30, 2018, compared to 27.7% for the three months ended September 30, 2017. The decrease in the gross profit percentage is due to 1) the increase in sales to commercial customers that have lower margins than retail customers and 2) the higher cost of inventory for acquired companies. As we acquire companies, the cost of their inventory, recorded at fair market value, has an initial higher cost than pre-acquisition inventory values. As the purchased inventory is being sold, since it has a higher cost basis, margins are lower. Once the acquired inventory is sold through, which takes approximately three months, the cost basis of inventory replaced is at a lower cost basis, which will be realized in future periods as higher gross margins. Commercial customers make up the majority of our revenues and we continue to target large commercial customers. The Company continues to focus on higher margin items and proprietary additives and other consumables that provide higher margin opportunities for us.
Operating Expenses
Operating expenses are comprised of store operations, primarily payroll, rent and utilities, and corporate overhead. Store operating costs were approximately $1.4 million for the three months ended September 30, 2018 and approximately $801,000 for the three months ended September 30, 2017, an increase of approximately $614,000 or 77%. The increase in store operating costs was directly attributable to the 109% increase in sales from the addition of eight (8) new locations, that were acquired in 2018, that were not open for any portion of the three months ended September 30, 2017 and our new e-commerce site that was acquired mid-September 2018. A Colorado store opened in Q4 2017 was closed on September 30, 2018 and those commercial customers will be serviced out of our Denver store. Store operating costs as a percentage of sales were 16.8% for the three months ended September 30, 2018, compared to 19.9% for the three months ended September 30, 2017. Operating costs, as a percentage of revenue, are affected in certain markets by seasonality. The second and third quarters are generally higher revenue months due to peak outdoor growing season during those months. Store operating costs were positively impacted by the acquisitions of new stores in 2018 which have a lower percentage of operating costs to revenues due to their larger size and higher volume. The net impact, as noted above, was lower store operating costs as a percentage of revenues. Corporate overhead was 15.7% of revenue for the three months ended September 30, 2018 and 19.2% for the three months ended September 30, 2017. Corporate overhead is comprised of general and administrative costs, share based compensation, depreciation and amortization and corporate salaries and was approximately $1.3 million for the three months ended September 30, 2018, compared to approximately $773,000 for the three months ended September 30, 2017. The increase in salaries expense from 2017 to 2018 was due primarily to the increase in corporate staff to support expanding operations including purchased store integrations, accounting and finance, information systems, purchasing and commercial sales staff, and online sales presence. It should be noted that when we consummate a new acquisition, purchasing and back office accounting functions are stripped from the new acquisitions and those functions are absorbed into our existing centralized purchasing and accounting and finance departments, thus delivering cost savings. Corporate salaries and related payroll costs as a percentage of sales were 5.5% for the three months ended September 30, 2018 compared to 6.7% for the three months ended September 30, 2017. General and administrative expenses comprised mainly of advertising and promotions, travel & entertainment, professional fees and insurance, were approximately $375,000 for the three months ended September 30, 2018 and approximately $238,000 for the three months ended September 30, 2017, with a majority of the increase related to advertising and promotion, travel and entertainment and legal fees. In the third quarter 2018, we incurred legal and audit fees related to two acquisitions. These types of costs were not incurred during the quarter ended September 30, 2017. General and administrative costs as a percentage of revenue were 4.5% for the three months ended September 30, 2018, and 5.9% for the three months ended September 30, 2017. As noted earlier, corporate overhead includes non-cash expenses, consisting primarily of depreciation and share based compensation, which was approximately $481,000 for the three months ended September 30, 2018, compared to approximately $266,000 for the three months ended September 30, 2017.
Net Loss
The net loss for the three months ended September 30, 2018 was $784,573, compared to a net loss of $460,887 for the three months ended September 30, 2017. The increase in the net loss from 2017 to 2018 of $323,686 was primarily due to (1) an increase in amortization of debt discount, share based compensation and depreciation of $451,813, all non-cash expenses, and (2) increases in other corporate overhead of $328,831 offset by the approximately $427,000 increase in net margin contribution in 2018 after deducting store operating costs.
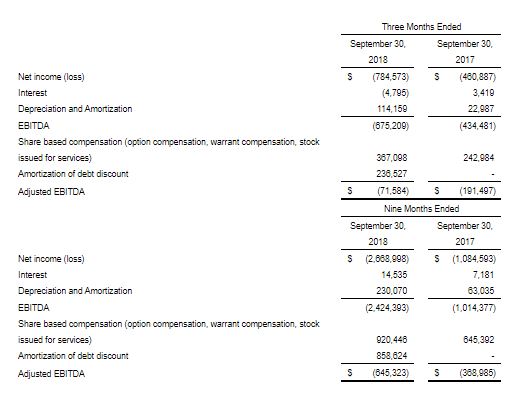
Adjusted EBITDA for the quarter ended September 30, 2018 was $(71,584) compared to adjusted EBITDA of $(191,497) for the quarter ended September 30, 2017 (see definition and further discussion about the presentation of EBITDA, a non-GAAP term, below).
Balance Sheet Summary
As of September 30, 2018, we had total assets of $36.0 million, compared to $9.0 million as of December 31, 2017, working capital of approximately $23.1 million, compared to working capital of approximately $5.6 million as of December 31, 2017, an increase of approximately $17.5 million. The increase in working capital from December 31, 2017 to June 30, 2018 was due primarily to the receipt of proceeds from, an equity private placement offering of $10 million, a convertible debt offering of $9 million and proceeds from the exercise of warrants and options of $2.5 million. At September 30, 2018, we had cash and cash equivalents of approximately $14.3 million. At the date of this filing We believe that existing cash and cash equivalents are sufficient to fund existing operations for the next twelve months.
Use of Non-GAAP Financial Information
The Company believes that the presentation of results excluding certain items in “Adjusted EBITDA,” such as non-cash equity compensation charges, provides meaningful supplemental information to both management and investors, facilitating the evaluation of performance across reporting periods. The Company uses these non-GAAP measures for internal planning and reporting purposes. These non-GAAP measures are not in accordance with, or an alternative for, generally accepted accounting principles and may be different from non-GAAP measures used by other companies. The presentation of this additional information is not meant to be considered in isolation or as a substitute for net income or net income per share prepared in accordance with generally accepted accounting principles.
Set forth below is a reconciliation of Adjusted EBITDA to net income (loss):
 About GrowGeneration Corp.:
GrowGen USA owns and operates specialty retail hydroponic and organic gardening stores. Currently, GrowGen USA has 18 stores, which includes 5 locations in Colorado, 6 locations in California, 1 location in Las Vegas, 1 location in Washington, 3 locations in Michigan, 1 location in Rhode Island and 1 location in Oklahoma. GrowGen USA also operates an online superstore for cultivators, located at HeavyGardens.com. GrowGen USA carries and sells thousands of products, including organic nutrients and soils, advanced lighting technology and state of the art hydroponic equipment to be used indoors and outdoors by commercial and home growers. Our mission is to own and operate GrowGeneration branded stores in all the major legalized cannabis states in the U.S. and Canada. Management estimates that roughly 1,000 hydroponic stores are in operation in the U.S. By 2020 the market is estimated to reach over $23 billion with a compound annual growth rate of 32%.
 Original Press Release