![]()
ScottsMiracle-Gro Announces First Quarter Results; Increases Full-Year Sales Outlook for U.S. Consumer Segment
Restructuring of Hawthorne manufacturing footprint announced in effort to drive efficiencies and improve competitive position by reducing costs of LED lighting units
MARYSVILLE, Ohio, Feb. 01, 2022 (GLOBE NEWSWIRE) — The Scotts Miracle-Gro Company (NYSE: SMG), one of the world’s leading marketers of branded consumer lawn and garden as well as hydroponic and indoor growing products, today announced financial results for its fiscal first quarter highlighted by a profitable quarter in the U.S. Consumer segment for only the second time in company history.
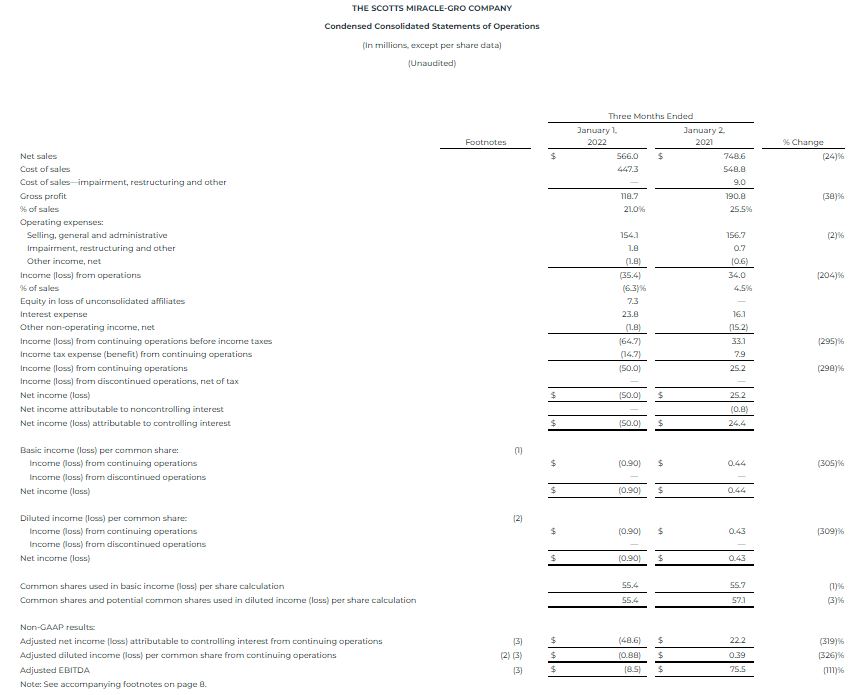
Company-wide sales in the quarter decreased 24 percent to $566.0 million, consistent with a pre-announcement of expected results issued on January 4. For the quarter ended January 1, 2022, the company reported a seasonal loss from continuing operations of $0.90 per share. The non-GAAP adjusted loss – which is the basis of the Company’s guidance – was $0.88 per share.
“The U.S. Consumer segment continues to exceed our expectations and got off to a good start, especially given the difficult comparison from the 147 percent growth the segment reported in the first quarter a year ago,” said Jim Hagedorn, chairman and chief executive officer. “Consumer purchases at our largest retail partners increased 3 percent in units for the quarter and 9 percent in dollars against 40 percent growth for each measure a year ago. The continued level of consumer and retailer support leaves us optimistic about the strength of the segment as we prepare for the upcoming lawn and garden season.
While Hawthorne sales declined due to broader market conditions, we made two important acquisitions during the quarter and took several steps to strengthen the business when growth returns. We have told shareholders for years that our results in this segment could be choppy at times, but our long-term optimism about the industry, and our confidence in the Hawthorne business, is unchanged.
 Jim Hagedorn, chairman and chief executive officer
First quarter details
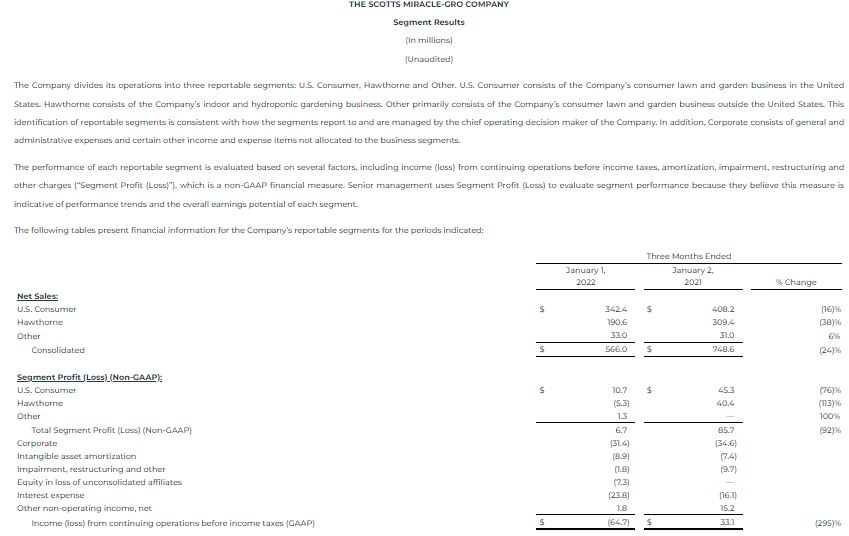
For the fiscal first quarter, the Company reported sales of $566.0 million, down 24 percent from $748.6 million a year ago. First quarter sales for the Hawthorne segment decreased 38 percent to $190.6 million. The decline, which was against growth of 71 percent for the same period a year ago, had been previously announced and was driven primarily by an over-supply of cannabis grown in state-authorized markets that has led to a temporary decline in commercial cultivation activity. Supply chain disruptions also contributed to the decline. The segment reported a loss of $5.3 million in the quarter compared to income of $40.4 million a year ago.
U.S. Consumer segment sales decreased 16 percent to $342.4 million. The decline was better than expected given the 147 percent revenue growth in the first quarter a year ago. The segment reported income of $10.7 million, compared with the record result of $45.3 million a year ago. The result marked only the second time the segment has recorded a profit in the first quarter.
The Company said the better-than-expected result in U.S. Consumer, coupled with additional pricing actions that will take effect in the third quarter, is allowing it to increase full-year sales guidance in the segment to a range of plus 2 percent to minus 2 percent. This compares to a previous range of flat to minus 4 percent. The improved guidance does not require the Company to adjust its outlook for the balance of the lawn and garden season but allows it to maintain guidance for adjusted earnings per share despite its recently revised reduction in the full-year sales outlook for Hawthorne.
The company-wide GAAP and non-GAAP adjusted gross margin rates were 21.0 percent compared with 25.5 percent and 26.7 percent, respectively, a year ago. The decline was driven primarily by a decrease in fixed cost leverage as well as higher material, warehousing and distribution costs and was partially offset by increased pricing benefits as well as favorable segment mix. Selling, general and administrative expenses (SG&A) decreased 2 percent to $154.1 million.
“Most of the gross margin rate decline in the quarter was expected due to lower fixed cost leverage compared with year-ago volume that was at record levels,” said Cory Miller, chief financial officer. “While material costs were higher than our original estimates, we have communicated an additional price increase to our retail partners that should keep us on track to cover increased commodity costs on a full-year basis. We have been encouraged in recent weeks to see a decline in several key raw material inputs, which seeds a level of cautious optimism that the pressure we’ve been dealing with for the past year may finally be easing.”
On a company-wide basis, the GAAP loss from continuing operations was $50.0 million, or $0.90 per share, compared with income of $25.2 million, or $0.43 per share, for the first quarter of fiscal 2021. Those results include impairment, restructuring and other non-recurring items. Excluding those items, the non-GAAP loss was $48.6 million, or $0.88 per share, compared with adjusted income of $22.2 million, or $0.39 per share, last year.
Hawthorne restructuring
Separately, the Company announced plans to consolidate U.S. lighting manufacturing for Hawthorne into a single location and to close another recently acquired assembly facility and move those operations to its Santa Rosa, California facility. A restructuring charge of up to $5 million is expected to be recorded in the second quarter and will be excluded from the Company’s full-year adjusted results.
“This consolidation has been under consideration for months and, given the current market conditions and our strong inventory position, we chose to make these moves now with limited impact on the business,” Miller said. “As important, the consolidation of our manufacturing footprint is expected to dramatically lower the per-unit price of some of our most important LED lighting fixtures, which we believe will strengthen Hawthorne’s competitive position in the years to come.”
Conference Call and Webcast Scheduled for 9:00 a.m. EST Today, Feb. 1
The Company will discuss results during a webcast and conference call today at 9:00 a.m. EST. To participate in the conference call, please call 1-888-394-8218 (Conference Code: 1265183). A replay of the call can be heard by calling 1-888-203-1112. The replay will be available for 15 days. A live webcast of the call and the press release will be available on the Company’s investor relations website at http://investor.scotts.com. An archive of the press release and any accompanying information will remain available for at least a 12-month period.
About ScottsMiracle-Gro
With approximately $4.9 billion in sales, the Company is one of the world’s largest marketers of branded consumer products for lawn and garden care. The Company’s brands are among the most recognized in the industry. The Company’s Scotts®, Miracle-Gro® and Ortho® brands are market-leading in their categories. The Company’s wholly-owned subsidiary, The Hawthorne Gardening Company, is a leading provider of nutrients, lighting and other materials used in the indoor and hydroponic growing segment. Another wholly-owned subsidiary, The Hawthorne Collective, has been established to invest in emerging areas of the cannabis industry. For additional information, visit us at www.scottsmiraclegro.com.
THE SCOTTS MIRACLE-GRO COMPANY
Segment Results
(In millions)
(Unaudited)
The Company divides its operations into three reportable segments: U.S. Consumer, Hawthorne and Other. U.S. Consumer consists of the Company’s consumer lawn and garden business in the United States. Hawthorne consists of the Company’s indoor and hydroponic gardening business. Other primarily consists of the Company’s consumer lawn and garden business outside the United States. This identification of reportable segments is consistent with how the segments report to and are managed by the chief operating decision maker of the Company. In addition, Corporate consists of general and administrative expenses and certain other income and expense items not allocated to the business segments.
The performance of each reportable segment is evaluated based on several factors, including income (loss) from continuing operations before income taxes, amortization, impairment, restructuring and other charges (“Segment Profit (Loss)”), which is a non-GAAP financial measure. Senior management uses Segment Profit (Loss) to evaluate segment performance because they believe this measure is indicative of performance trends and the overall earnings potential of each segment.
The following tables present financial information for the Company’s reportable segments for the periods indicated:

THE SCOTTS MIRACLE-GRO COMPANY
Footnotes to Preceding Financial Statements
(1) Basic income (loss) per common share amounts are calculated by dividing income (loss) attributable to controlling interest from continuing operations, income (loss) from discontinued operations and net income (loss) attributable to controlling interest by the weighted average number of common shares outstanding during the period.
(2) Diluted income (loss) per common share amounts are calculated by dividing income (loss) attributable to controlling interest from continuing operations, income (loss) from discontinued operations and net income (loss) attributable to controlling interest by the weighted average number of common shares, plus all potential dilutive securities (common stock options, performance shares, performance units, restricted stock and restricted stock units) outstanding during the period.
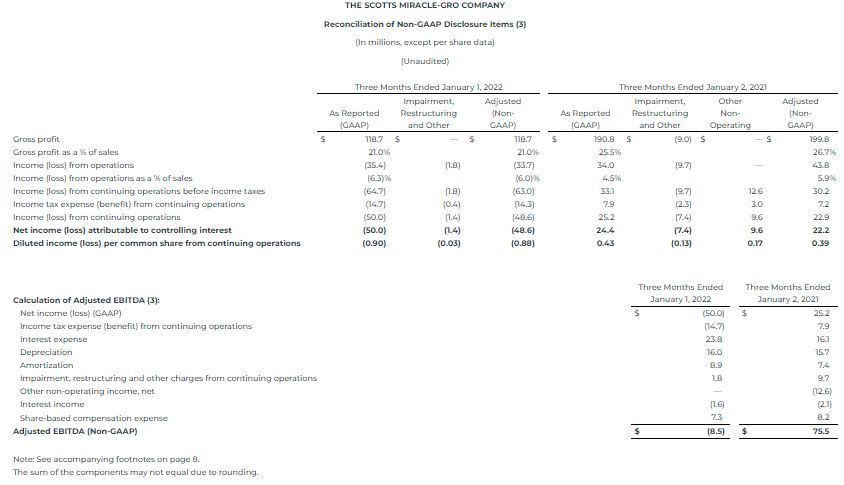
(3) Reconciliation of Non-GAAP Measures
Use of Non-GAAP Measures
To supplement the financial measures prepared in accordance with U.S. generally accepted accounting principles (“GAAP”), the Company uses non-GAAP financial measures. The reconciliations of these non-GAAP financial measures to the most directly comparable financial measures calculated and presented in accordance with GAAP are shown in the tables above. These non-GAAP financial measures should not be considered in isolation from, or as a substitute for or superior to, financial measures reported in accordance with GAAP. Moreover, these non-GAAP financial measures have limitations in that they do not reflect all the items associated with the operations of the business as determined in accordance with GAAP. Other companies may calculate similarly titled non-GAAP financial measures differently than the Company, limiting the usefulness of those measures for comparative purposes.
In addition to GAAP measures, management uses these non-GAAP financial measures to evaluate the Company’s performance, engage in financial and operational planning and determine incentive compensation because it believes that these measures provide additional perspective on and, in some circumstances are more closely correlated to, the performance of the Company’s underlying, ongoing business.
Management believes that these non-GAAP financial measures are useful to investors in their assessment of operating performance and the valuation of the Company. In addition, these non-GAAP financial measures address questions routinely received from analysts and investors and, in order to ensure that all investors have access to the same data, management has determined that it is appropriate to make this data available to all investors. Non-GAAP financial measures exclude the impact of certain items (as further described below) and provide supplemental information regarding operating performance. By disclosing these non-GAAP financial measures, management intends to provide investors with a supplemental comparison of operating results and trends for the periods presented. Management believes these non-GAAP financial measures are also useful to investors as such measures allow investors to evaluate performance using the same metrics that management uses to evaluate past performance and prospects for future performance. Management views free cash flow as an important measure because it is one factor used in determining the amount of cash available for dividends and discretionary investment.
Exclusions from Non-GAAP Financial Measures
Non-GAAP financial measures reflect adjustments based on the following items:
- Impairments, which are excluded because they do not occur in or reflect the ordinary course of the Company’s ongoing business operations and their exclusion results in a metric that provides supplemental information about the sustainability of operating performance.
- Restructuring and employee severance costs, which include charges for discrete projects or transactions that fundamentally change the Company’s operations and are excluded because they are not part of the ongoing operations of its underlying business, which includes normal levels of reinvestment in the business.
- Costs related to refinancing, which are excluded because they do not typically occur in the normal course of business and may obscure analysis of trends and financial performance. Additionally, the amount and frequency of these types of charges is not consistent and is significantly impacted by the timing and size of debt financing transactions.
- Discontinued operations and other unusual items, which include costs or gains related to discrete projects or transactions and are excluded because they are not comparable from one period to the next and are not part of the ongoing operations of the Company’s underlying business.
The tax effect for each of the items listed above is determined using the tax rate and other tax attributes applicable to the item and the jurisdiction(s) in which the item is recorded.
Definitions of Non-GAAP Financial Measures
The reconciliations of non-GAAP disclosure items include the following financial measures that are not calculated in accordance with GAAP and are utilized by management in evaluating the performance of the business, engaging in financial and operational planning, determining incentive compensation and determining the amount of cash available for dividends and discretionary investments, and by investors and analysts in evaluating performance of the business:
Adjusted gross profit: Gross profit excluding impairment, restructuring and other charges / recoveries.
Adjusted income (loss) from operations: Income (loss) from operations excluding impairment, restructuring and other charges / recoveries.
Adjusted income (loss) from continuing operations before income taxes: Income (loss) from continuing operations before income taxes excluding impairment, restructuring and other charges / recoveries, costs related to refinancing and other non-operating income / expense.
Adjusted income tax expense (benefit) from continuing operations: Income tax expense (benefit) from continuing operations excluding the tax effect of impairment, restructuring and other charges / recoveries, costs related to refinancing and other non-operating income / expense.
Adjusted income (loss) from continuing operations: Income (loss) from continuing operations excluding impairment, restructuring and other charges / recoveries, costs related to refinancing and other non-operating income / expense, each net of tax.
Adjusted net income (loss) attributable to controlling interest from continuing operations: Net income (loss) attributable to controlling interest excluding impairment, restructuring and other charges / recoveries, costs related to refinancing, other non-operating income / expense and discontinued operations, each net of tax.
Adjusted diluted income (loss) per common share from continuing operations: Diluted net income (loss) per common share from continuing operations excluding impairment, restructuring and other charges / recoveries, costs related to refinancing and other non-operating income / expense, each net of tax.
Adjusted EBITDA: Net income (loss) before interest, taxes, depreciation and amortization as well as certain other items such as the impact of the cumulative effect of changes in accounting, costs associated with debt refinancing and other non-recurring or non-cash items affecting net income (loss). The presentation of adjusted EBITDA is intended to be consistent with the calculation of that measure as required by the Company’s borrowing arrangements, and used to calculate a leverage ratio (maximum of 4.50 at January 1, 2022) and an interest coverage ratio (minimum of 3.00 for the twelve months ended January 1, 2022).
For the three months ended January 2, 2021, the following items were adjusted, in accordance with the definitions above, to arrive at the non-GAAP financial measures:
- During the three months ended January 2, 2021, the Company incurred costs of $8.7 million in the “Cost of sales—impairment, restructuring and other” line in the Condensed Consolidated Statements of Operations and incurred costs of $0.6 million in the “Impairment, restructuring and other” line in the Condensed Consolidated Statements of Operations associated with the COVID-19 pandemic primarily related to premium pay.
- On December 31, 2020, pursuant to the terms of the Contribution and Unit Purchase Agreement between the Company and Alabama Farmers Cooperative, Inc. (“AFC”), the Company acquired a 50% equity interest in the Bonnie Plants business through a newly formed joint venture with AFC (“Bonnie Plants, LLC”) in exchange for a cash payment of $100.7 million, forgiveness of the Company’s outstanding loan receivable with AFC and termination of the Company’s options to increase its economic interest in the Bonnie Plants business. The Company’s loan receivable with AFC, which was previously recognized in the “Other assets” line in the Condensed Consolidated Balance Sheets, had a carrying value of $66.4 million on December 31, 2020 and the Company recognized a gain of $12.5 million during the first quarter of fiscal 2021 to write-up the value of the loan to its closing date fair value in the “Other non-operating income, net” line in the Condensed Consolidated Statements of Operations. The Company’s interest in Bonnie Plants, LLC had an initial fair value of $202.9 million and is recorded in the “Investment in unconsolidated affiliates” line in the Condensed Consolidated Balance Sheets. The Company’s interest is accounted for using the equity method of accounting, with the Company’s proportionate share of Bonnie Plants, LLC earnings subsequent to December 31, 2020 reflected in the Condensed Consolidated Statements of Operations.