![]()
ScottsMiracle-Gro Reports Fiscal 2023 Second Quarter Results
- U.S. Consumer First Half Sales of $1.73B in Line with Record Prior Two Years
- Fiscal 2Q23 GAAP EPS of $1.94; non-GAAP Adjusted EPS of $3.78
- Net Leverage Ratio within Covenant at 6.0X
- Project Springboard to Deliver Annualized Savings Over $200 million
- Updated Full Year Outlook to be Provided in June
MARYSVILLE, Ohio, May 03, 2023 (GLOBE NEWSWIRE) — The Scotts Miracle-Gro Company (NYSE: SMG), the world’s leading marketer of branded consumer lawn and garden as well as indoor and hydroponic growing products, today announced results for its fiscal second quarter ended April 1, 2023.
Fiscal 2023 is a testament to the powerful franchise of our core lawn and garden business. Our work has been marked by record retailer shipments, POS lifts and reliable cash generation. We are de-levering as planned and enhancing our ability to invest in growth and long-term shareholder value.
 Jim Hagedorn, chairman and CEO
Looking ahead, our collaboration with retailers is tighter than ever and our combined promotional activities will keep consumers engaged through the season. The bigger story is we’re moving toward the transition phase of our recovery with more freedom to operate.
Second Quarter Highlights
U.S. Consumer net sales decreased 2 percent versus record high sales in the same period last year, bringing first half 2023 sales just ahead of prior year and within 3 percent of the Company’s record first half in 2021. The Company said this reflects the strong partnership with retailers on first half load-in and unparalleled execution by ScottsMiracle-Gro operators and associates. For the U.S. Consumer business, the first half of the fiscal year typically comprises 55 to 60 percent of full-year net sales but less than 30 percent of POS.
After a slow start through March, partly driven by extreme weather in the West, the U.S. Consumer business saw improved consumer demand entering May. Even in the uncertain macroeconomic environment, consumers remain engaged in lawn and garden and are reacting positively to the Company’s branded promotions, especially where weather has been favorable. The DayLawn Saving and Scott for Scotts marketing campaigns and more recent in-store activities such as Spring Black Friday and SpringFest events have helped drive earlier consumer engagement. Based on the mix of consumer takeaway through April, the Company expects full-year POS volume to meet original expectations based on stronger performance in growing media and premium lawn fertilizers, offset by lower volumes in grass seed and private-label fertilizers. With strong productivity and cost savings from Project Springboard, the total company gross margin rate is still expected to approximate a 100 basis point decline year over year despite the shift in category mix and increased trade investments.
At Hawthorne, the team remains focused on cost control and restructuring efforts. During the quarter, Hawthorne further optimized its distribution network by initiating the closure of four distribution centers. Additionally, the non-core Hurricane branded fans business was sold. The Company recorded pre-tax restructuring charges of $141 million in the quarter associated with these activities.
“The Hawthorne team has shown resilience through sustained industry challenges, and I commend them for overdelivering on our original Project Springboard targets and remaining focused on strategic execution,” said Matt Garth, executive vice president and chief financial officer. “While we still expect daily sales rates to improve in the back half of the year, continued industry challenges make it difficult to provide topline guidance today. Instead, our full focus remains on cost control and getting back to run rate profitability by fiscal year-end. In recognition of the prevailing headwinds, we now expect a mid-single-digits percentage decline in total Company operating income and a low single-digits percentage decline in adjusted EBITDA for the full year.”
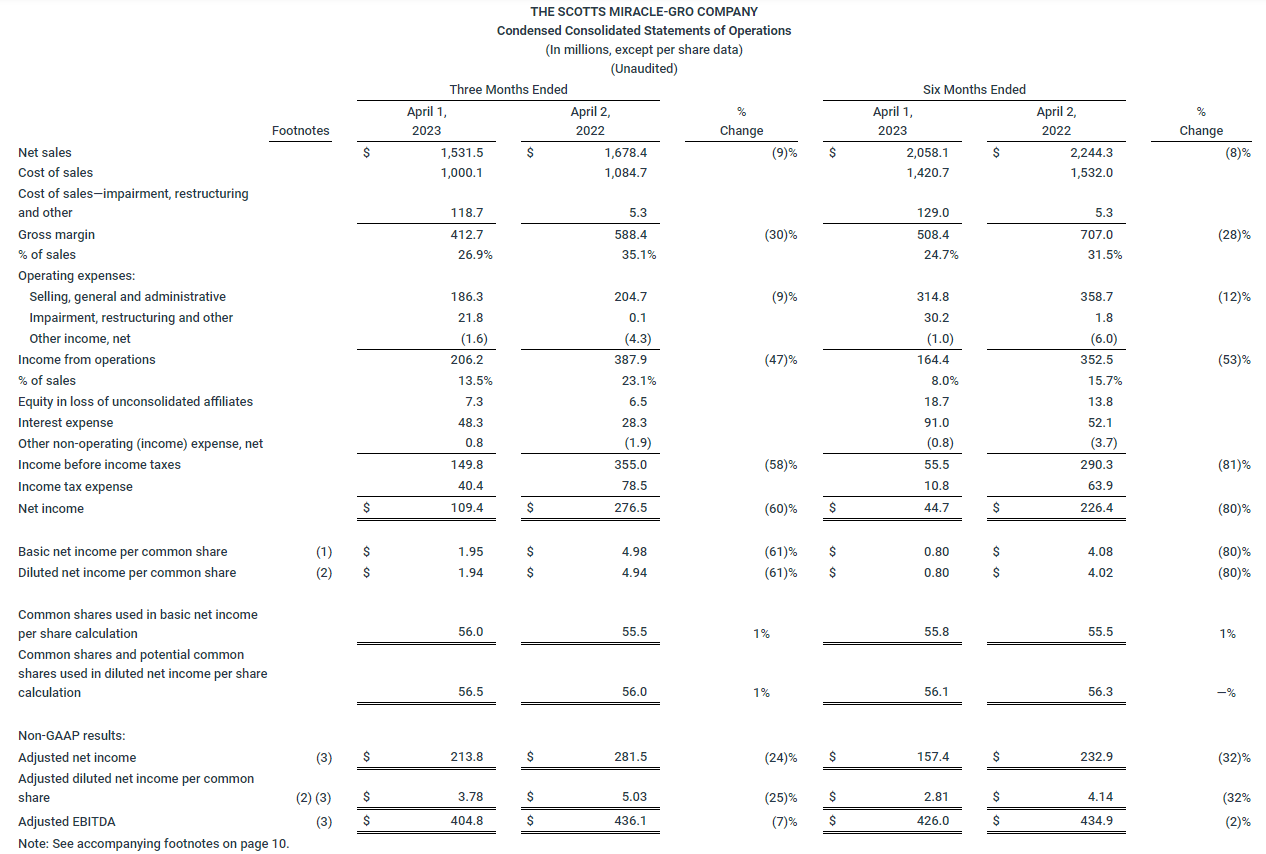
The Company reported GAAP income of $1.94 per diluted share for the quarter. Non-GAAP adjusted earnings, the basis of the Company’s guidance, was $3.78 per diluted share.
Financial Results
Second Quarter Details
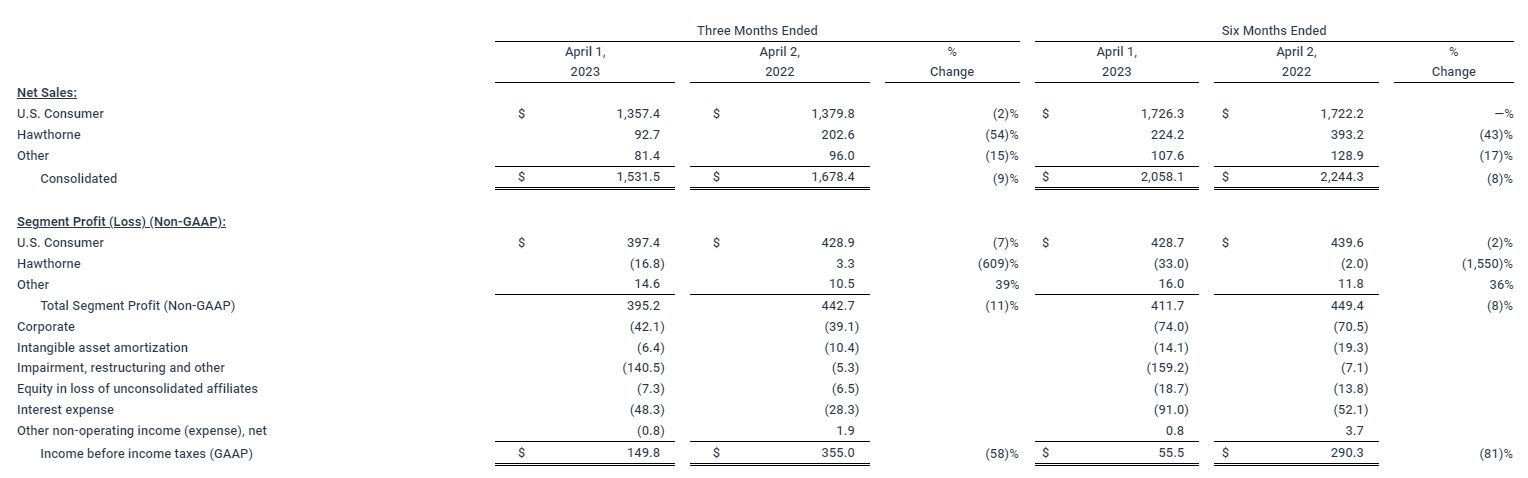
For the quarter ended April 1, 2023, company-wide sales decreased 9 percent to $1.53 billion. U.S. Consumer segment sales decreased 2 percent to $1.36 billion, from a record $1.38 billion last year. Hawthorne segment sales decreased 54 percent to $93 million, compared with $203 million during the same period a year ago, reflecting the continued challenges in the hydroponic industry.
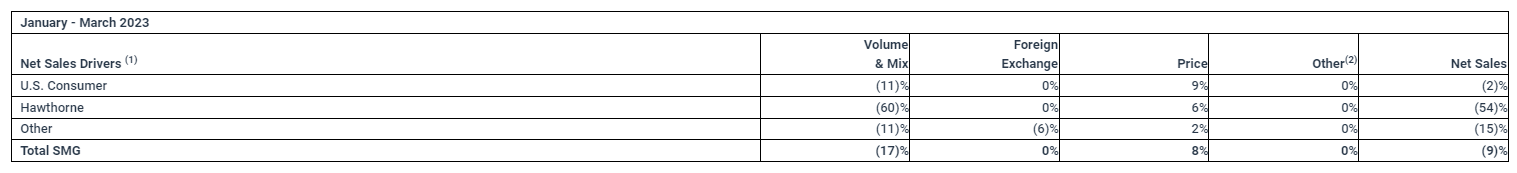
(1) Net Sales percentage changes are approximations based on quantitative formulas that are consistently applied
(2) Other includes the impact of acquisitions and divestitures
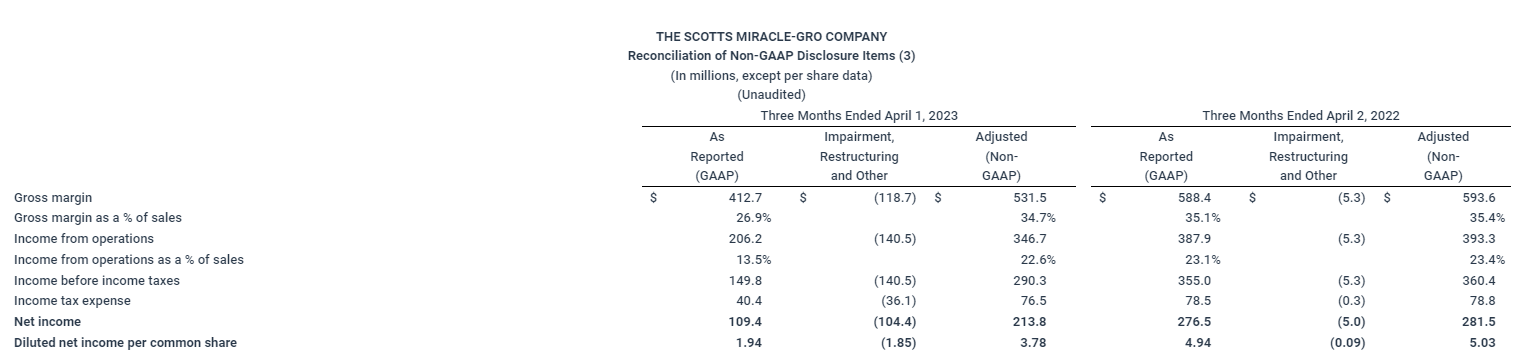
GAAP and non-GAAP adjusted gross margin rates for the quarter were 26.9 percent and 34.7 percent, respectively. The GAAP and non-GAAP gross margin rates were 35.1 percent and 35.4 percent, respectively, in the second quarter of last year. Higher commodities and unfavorable conversion and fixed cost leverage, primarily related to volume loss at Hawthorne and lower production volumes in our U.S. consumer business, continued to drive the non-GAAP gross margin rate decline as expected for the quarter. Those pressures were mostly offset by last year’s net price increases and earlier-than-planned Springboard distribution savings from restructuring at Hawthorne. Mix had a negligible impact on year-over-year net sales or gross margin rate.
Project Springboard has also contributed to a 9 percent reduction in SG&A to $186 million from $205 million a year ago.
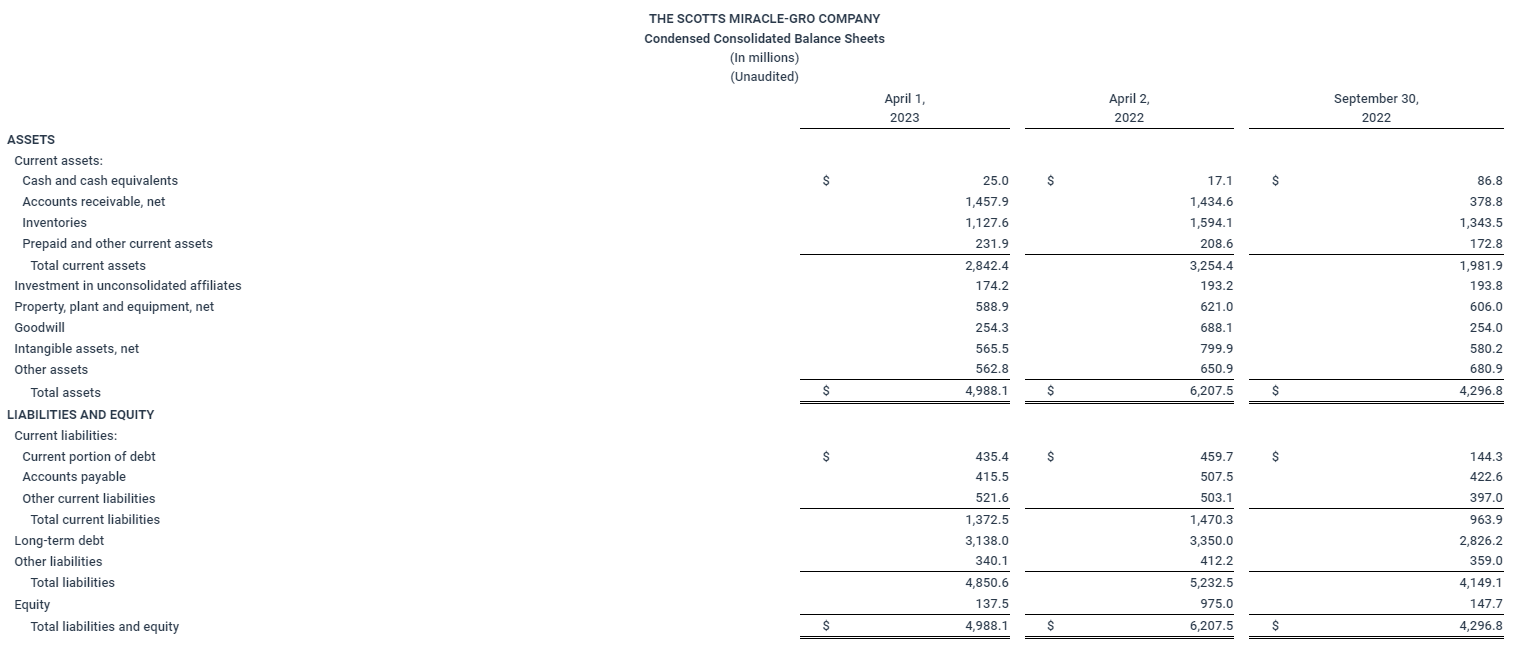
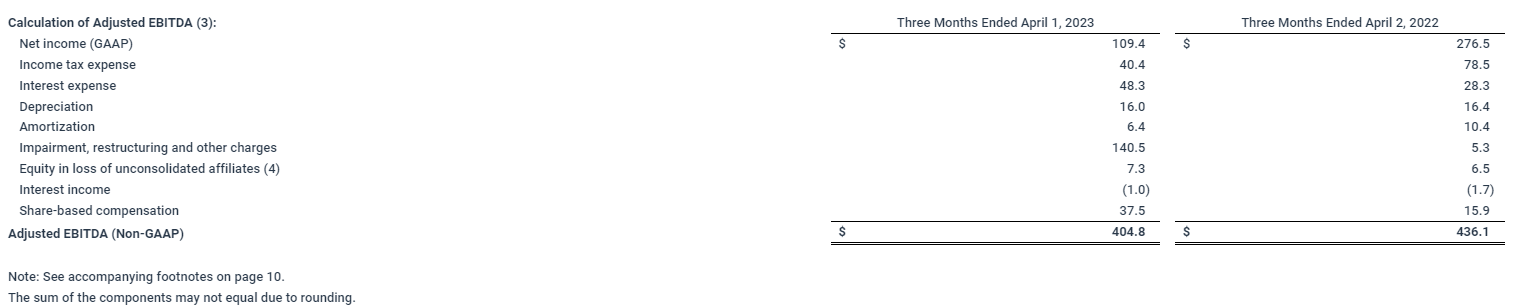
Interest expense increased $20 million year over year to $48 million, driven mainly by higher interest rates. The Company’s average net debt-to-EBITDA ratio at the end of the quarter was 6.0 times versus the covenant maximum of 6.5 times. The maximum remains at 6.5 times next quarter before returning to 6.25 times in the fourth quarter of the fiscal year.
The Company reported GAAP net income of $109.4 million, or $1.94 per diluted share, compared with prior year earnings of $276.5 million, or $4.94 per diluted share. The current and prior results include after-tax impairment, restructuring, and other non-recurring items of $104.4 million and $5.0 million, respectively. Excluding these charges, non-GAAP adjusted earnings in the quarter were $213.8 million, or $3.78 per diluted share, compared with earnings of $281.5 million, or $5.03 per diluted share, in the second quarter of 2022.
Year-to-date details
For the first six months of fiscal 2023, the Company reported sales of $2.06 billion, down 8 percent from $2.24 billion a year earlier. U.S. Consumer segment sales increased slightly to $1.73 billion. Sales for the Hawthorne segment decreased 43 percent to $224 million.
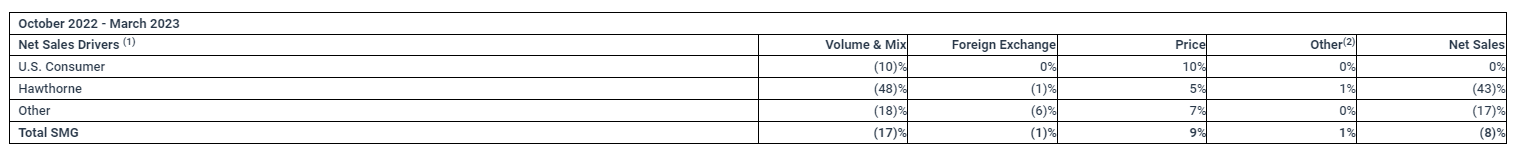
(1) Net Sales percentage changes are approximations based on quantitative formulas that are consistently applied
(2) Other includes the impact of acquisitions and divestitures
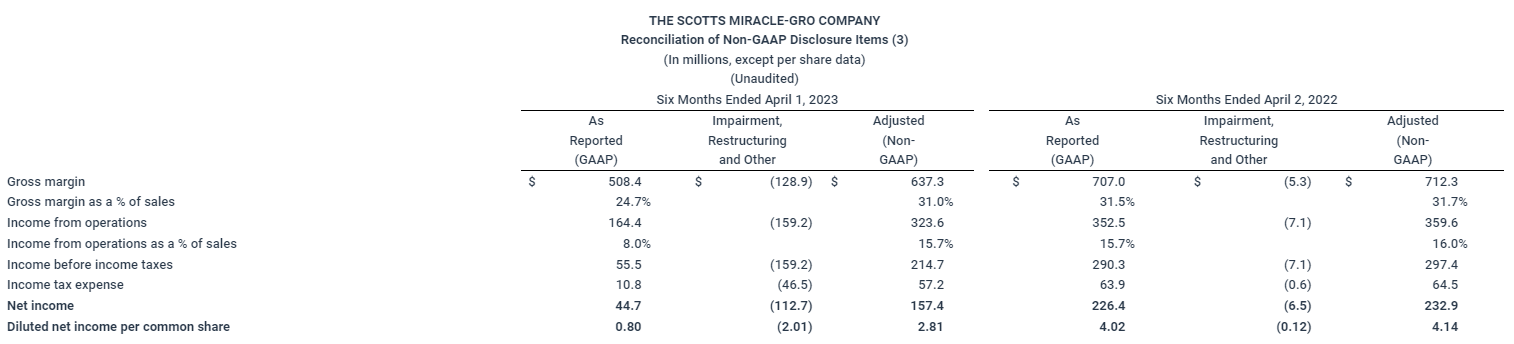
The company-wide gross margin rate was 24.7 percent on a GAAP basis and 31.0 percent on a non-GAAP adjusted basis compared with rates of 31.5 percent and 31.7 percent, respectively, a year ago. SG&A decreased 12 percent to $315 million.
The progress on gross margin rates and SG&A improvements are reflective of the Company’s Project Springboard actions that are now slated to deliver at least $200 million in run-rate savings by fiscal year-end.
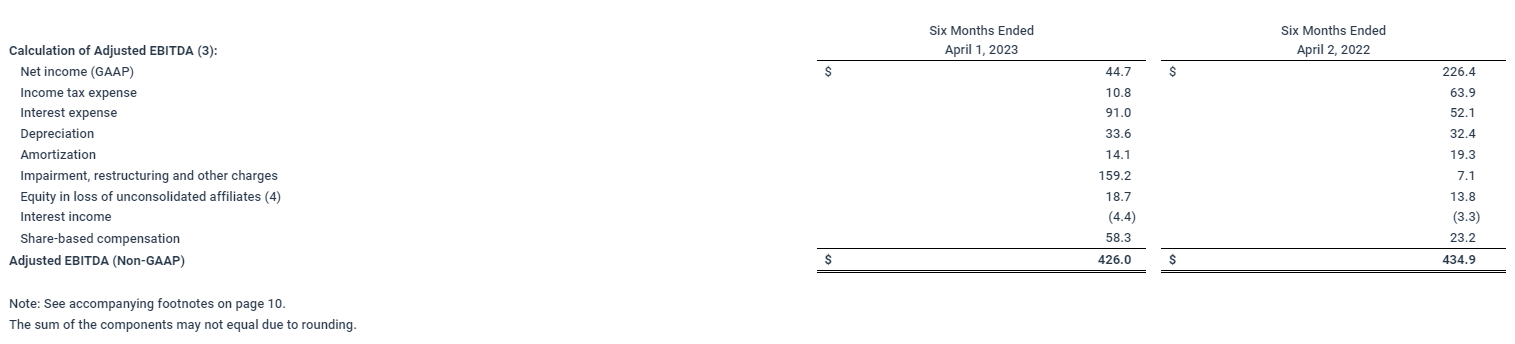
On a company-wide basis, GAAP net income was $44.7 million, or $0.80 per diluted share, compared with $226.4 million, or $4.02 per diluted share, for the first six months of fiscal 2022. Excluding impairment, restructuring, and other non-recurring items, non-GAAP adjusted earnings were $157.4 million, or $2.81 per diluted share, compared with $232.9 million, or $4.14 per diluted share, last year.
“We’ve seen more than $500 million in additional commodity costs over the past three years,” Garth said. “While some commodity costs are moderating, they are still higher than two years ago. We will not begin to see the benefit of this moderation until fiscal 2024 as we work down higher-priced inventories and return to normal production volumes. I’m proud of the progress our team continues to make in improving gross margin rates through Project Springboard and net pricing actions.”
Hawthorne Restructuring – Closure of Four Distribution Centers
Hawthorne also announced the sale of its Hurricane branded fans business, which closed on March 30, 2023. This divestiture helps accelerate Hawthorne’s closures of four additional warehouse facilities in Vancouver, WA; Gresham, OR; Phillipsburg, NJ; and San Bernardino, CA. Costs associated with these actions are included in the second quarter restructuring charges.
Fiscal 2023 Outlook
The Company’s current outlook for fiscal 2023 as compared to fiscal 2022 is as follows:
- Near 100 basis points decline in gross margin rate
- Mid-single-digits percentage decline in adjusted operating income
- Low single-digits percentage decline in adjusted EBITDA
- Interest expense increase of approximately $60 million
- Effective tax rate of 27 to 28 percent
- Free cash flow of $1 billion over the next two years
The Company expects to provide an update on business results and outlook in early June as is typical near the end of the spring season.
Conference Call and Webcast Scheduled for 9 a.m. ET Today, May 3
The Company will discuss the results during a webcast and conference call today at 9:00 a.m. ET. To participate in the conference call, please register in advance at this link. Upon registration, all telephone participants will receive the dial-in number along with a unique PIN number that can be used to access the call. If you do not anticipate asking a question, we recommend joining via the live webcast on the Company’s investor relations website at http://investor.scotts.com. The replay of the conference call will also be available on the Company’s website, where an archive of the press release and any accompanying information will remain available for at least a 12-month period.
About ScottsMiracle-Gro
With approximately $3.9 billion in sales, the Company is the world’s largest marketer of branded consumer products for lawn and garden care. The Company’s brands are among the most recognized in the industry. The Company’s Scotts®, Miracle-Gro®, and Ortho® brands are market-leading in their categories. The Company’s wholly-owned subsidiary, The Hawthorne Gardening Company, is a leading provider of nutrients, lighting, and other materials used in the indoor and hydroponic growing segment. For additional information, visit us at www.scottsmiraclegro.com.
The Company divides its operations into three reportable segments: U.S. Consumer, Hawthorne and Other. U.S. Consumer consists of the Company’s consumer lawn and garden business in the United States. Hawthorne consists of the Company’s indoor and hydroponic gardening business. Other primarily consists of the Company’s consumer lawn and garden business outside the United States. This identification of reportable segments is consistent with how the segments report to and are managed by the chief operating decision maker of the Company. In addition, Corporate consists of general and administrative expenses and certain other income and expense items not allocated to the business segments.
The performance of each reportable segment is evaluated based on several factors, including income (loss) before income taxes, amortization, impairment, restructuring and other charges (“Segment Profit (Loss)”), which is a non-GAAP financial measure. Senior management uses Segment Profit (Loss) to evaluate segment performance because they believe this measure is indicative of performance trends and the overall earnings potential of each segment.
The following tables present financial information for the Company’s reportable segments for the periods indicated:
(1) Basic net income (loss) per common share amounts are calculated by dividing net income (loss) by the weighted average number of common shares outstanding during the period.
(2) Diluted net income (loss) per common share amounts are calculated by dividing net income (loss) by the weighted average number of common shares, plus all potential dilutive securities (common stock options, performance shares, performance units, restricted stock and restricted stock units) outstanding during the period.
(3) Reconciliation of Non-GAAP Measures
Use of Non-GAAP Measures
To supplement the financial measures prepared in accordance with U.S. generally accepted accounting principles (“GAAP”), the Company uses non-GAAP financial measures. The reconciliations of these non-GAAP financial measures to the most directly comparable financial measures calculated and presented in accordance with GAAP are shown in the tables above. These non-GAAP financial measures should not be considered in isolation from, or as a substitute for or superior to, financial measures reported in accordance with GAAP. Moreover, these non-GAAP financial measures have limitations in that they do not reflect all the items associated with the operations of the business as determined in accordance with GAAP. Other companies may calculate similarly titled non-GAAP financial measures differently than the Company, limiting the usefulness of those measures for comparative purposes.
In addition to GAAP measures, management uses these non-GAAP financial measures to evaluate the Company’s performance, engage in financial and operational planning and determine incentive compensation because it believes that these measures provide additional perspective on and, in some circumstances are more closely correlated to, the performance of the Company’s underlying, ongoing business.
Management believes that these non-GAAP financial measures are useful to investors in their assessment of operating performance and the valuation of the Company. In addition, these non-GAAP financial measures address questions routinely received from analysts and investors and, in order to ensure that all investors have access to the same data, management has determined that it is appropriate to make this data available to all investors. Non-GAAP financial measures exclude the impact of certain items (as further described below) and provide supplemental information regarding operating performance. By disclosing these non-GAAP financial measures, management intends to provide investors with a supplemental comparison of operating results and trends for the periods presented. Management believes these non-GAAP financial measures are also useful to investors as such measures allow investors to evaluate performance using the same metrics that management uses to evaluate past performance and prospects for future performance. Management views free cash flow as an important measure because it is one factor used in determining the amount of cash available for dividends and discretionary investment.
Exclusions from Non-GAAP Financial Measures
Non-GAAP financial measures reflect adjustments based on the following items:
- Impairments, which are excluded because they do not occur in or reflect the ordinary course of the Company’s ongoing business operations and their exclusion results in a metric that provides supplemental information about the sustainability of operating performance.
- Restructuring and employee severance costs, which include charges for discrete projects or transactions that fundamentally change the Company’s operations and are excluded because they are not part of the ongoing operations of its underlying business, which includes normal levels of reinvestment in the business.
- Costs related to refinancing, which are excluded because they do not typically occur in the normal course of business and may obscure analysis of trends and financial performance. Additionally, the amount and frequency of these types of charges is not consistent and is significantly impacted by the timing and size of debt financing transactions.
- Discontinued operations and other unusual items, which include costs or gains related to discrete projects or transactions and are excluded because they are not comparable from one period to the next and are not part of the ongoing operations of the Company’s underlying business.
The tax effect for each of the items listed above is determined using the tax rate and other tax attributes applicable to the item and the jurisdiction(s) in which the item is recorded.
Definitions of Non-GAAP Financial Measures
The reconciliations of non-GAAP disclosure items include the following financial measures that are not calculated in accordance with GAAP and are utilized by management in evaluating the performance of the business, engaging in financial and operational planning, determining incentive compensation and determining the amount of cash available for dividends and discretionary investments, and by investors and analysts in evaluating performance of the business:
Adjusted gross margin: Gross margin excluding impairment, restructuring and other charges / recoveries.
Adjusted income (loss) from operations: Income (loss) from operations excluding impairment, restructuring and other charges / recoveries.
Adjusted income (loss) before income taxes: Income (loss) before income taxes excluding impairment, restructuring and other charges / recoveries, costs related to refinancing and certain other non-operating income / expense items.
Adjusted income tax expense (benefit): Income tax expense (benefit) excluding the tax effect of impairment, restructuring and other charges / recoveries, costs related to refinancing and certain other non-operating income / expense items.
Adjusted net income (loss): Net income (loss) excluding impairment, restructuring and other charges / recoveries, costs related to refinancing and certain other non-operating income / expense items, each net of tax.
Adjusted diluted net income (loss) per common share: Diluted net income (loss) per common share excluding impairment, restructuring and other charges / recoveries, costs related to refinancing and certain other non-operating income / expense items, each net of tax.
Adjusted EBITDA: Net income (loss) before interest, taxes, depreciation and amortization as well as certain other items such as the impact of the cumulative effect of changes in accounting, costs associated with debt refinancing and other non-recurring or non-cash items affecting net income (loss). The presentation of adjusted EBITDA is intended to be consistent with the calculation of that measure as required by the Company’s borrowing arrangements, and used to calculate a leverage ratio (maximum of 6.50 at April 1, 2023) and an interest coverage ratio (minimum of 3.00 for the twelve months ended April 1, 2023).
For the three and six months ended April 1, 2023, the following items were adjusted, in accordance with the definitions above, to arrive at the non-GAAP financial measures:
- During fiscal 2022, the Company began implementing a series of Company-wide organizational changes and initiatives intended to create operational and management-level efficiencies. As part of this restructuring program, the Company is reducing the size of its supply chain network, reducing staffing levels and implementing other cost-reduction initiatives. During the three and six months ended April 1, 2023, the Company incurred costs of $118.7 million and $128.2 million, respectively, in the “Cost of sales—impairment, restructuring and other” line in the Condensed Consolidated Statements of Operations and $18.1 million and $23.2 million, respectively, in the “Impairment, restructuring and other” line in the Condensed Consolidated Statements of Operations associated with this restructuring initiative primarily related to inventory write-down charges, employee termination benefits, facility closure costs and impairment of right-of-use assets and property, plant and equipment.
For the three and six months ended April 2, 2022, the following items were adjusted, in accordance with the definitions above, to arrive at the non-GAAP financial measures:
- During the second quarter of fiscal 2022, the Company announced plans to consolidate U.S. lighting manufacturing for its Hawthorne segment into a single location and to close another recently acquired assembly facility and move those operations to its Santa Rosa, California facility. During the three and six months ended April 2, 2022, the Company incurred costs of $5.3 million in the “Cost of sales—impairment, restructuring and other” line in the Condensed Consolidated Statements of Operations and $0.1 million in the “Impairment, restructuring and other” line in the Condensed Consolidated Statements of Operations related to employee termination benefits and impairment of property, plant and equipment associated with this restructuring initiative.