![]()
Jushi Holdings Inc. Reports Fourth Quarter and Full Year 2020 Financial Results and First Quarter 2021 Financial Results
Jim Cacioppo, the CEO, Chairman and Founder of Jushi Holdings Inc. (“Jushi” or the “Company”) (CSE: JUSH) (OTCMKTS: JUSHF), a vertically integrated, multi-state cannabis operator, provides a detailed operational update on the Company’s recent activities and progress, along with an overview of Jushi’s First Quarter 2021 Financial Results.
- Fourth Quarter 2020 Revenue Increases 29.6% to $32.3 million as compared to the Third Quarter 2020;
- First Quarter 2021 Revenue Increases 29.0% to $41.7 million as compared to the Fourth Quarter 2020;
- Provides Second Quarter 2021 Revenue and Adjusted EBITDA Guidance
BOCA RATON, Fla., June 09, 2021 (GLOBE NEWSWIRE) — Jushi Holdings Inc. (“Jushi” or the “Company”) (CSE: JUSH) (OTCMKTS: JUSHF), a vertically integrated, multi-state cannabis operator, announced its financial results for the fourth quarter and full year ended December 31, 2020, and its first quarter 2021 ended March 31, 2021 financial results. All financial information is provided in U.S. dollars unless otherwise indicated.
Fourth Quarter 2020 Highlights
- Total revenue increased 29.6% sequentially to $32.3 million
- Gross profit of $19.2 million, an increase of 56.6% sequentially
- Net loss of $156.7 million, driven primarily by the fair value losses on derivative warrant liabilities
- Adjusted EBITDA1 of $2.6 million
Full Year 2020 Highlights
- Total revenue increased approximately 689.6% year-over-year to $80.8 million
- Gross profit of $43.1 million, an increase of 793.0% year-over-year
- Net loss of $211.9 million, driven primarily by the fair value losses on derivative warrant liabilities
- Adjusted EBITDA1 loss of $3.0 million
First Quarter 2021 Highlights
- Total revenue of $41.7 million, an increase of 29.0% sequentially
- Gross profit of $20.1 million, an increase of 4.7% sequentially
- Net loss of $26.8 million, driven primarily by the fair value losses on derivative warrant liabilities, income tax expense, interest expense and finance charges
- Adjusted EBITDA1 of $3.0 million
- $167.9 million of cash and cash equivalents and short-term investments in securities on the balance sheet as of March 31, 2021
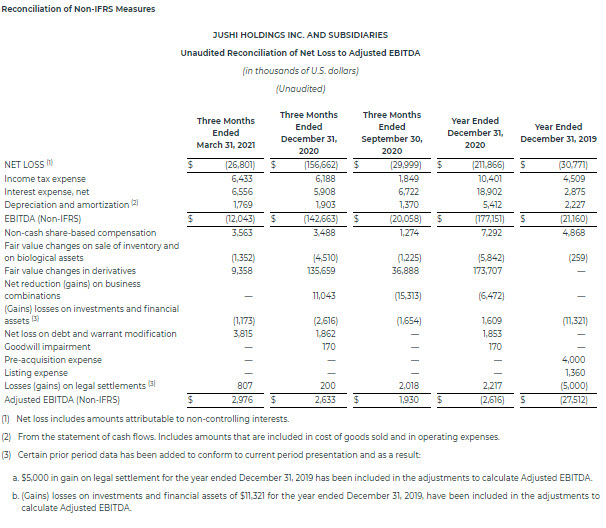
1 See “Reconciliation of Non-IFRS Financial Measures” at the end of this press release for more information regarding the Company’s use of non-IFRS financial measures.
Adjusted EBITDA, which is a non-IFRS measure, excludes certain items which are detailed and reconciled to the most comparable IFRS-reported measure in the attached “Reconciliation of Non-IFRS Measures.”
Recent Developments
- Announced it will open its 20th BEYOND/HELLOTM retail location nationwide and 13th store in Pennsylvania on June 11th, 2021
- Opened its 19th BEYOND/HELLOTM retail location nationwide and 12th store in Pennsylvania
- Closed acquisition of a 93,000 sq. ft. facility and nine acres of surrounding land operated by its wholly-owned subsidiary and Virginia-based pharmaceutical processor, Dalitso LLC
- Acquired 100% of the equity of Organic Solutions of the Desert, LLC, an operating dispensary located in Palm Springs, California, and approximately 78% of the equity of a retail license holder located in Grover Beach, California with the rights to acquire the remaining equity in the future
- Signed a definitive agreement to acquire OhiGrow, LLC, one of 34 licensed cultivators in Ohio, and Ohio Green Grow LLC (collectively, “OhiGrow”)
- Signed a definitive agreement to acquire Nature’s Remedy of Massachusetts, Inc., a vertically integrated, single-state operator in Massachusetts, operating two adult-use retail dispensaries and a 50,000 sq. ft. cultivation and production facility
- Completed previously announced acquisition of an established Nevada operator
- Commenced first phase of its previously announced expansion project at its Pennsylvania grower-processor facility
Financial Results for the Fourth Quarter and Full Year 2020
The following is a tabular summary and commentary of revenue, gross profit, net income (loss) and net income (loss) per share for the three-month periods ended December 31, 2020 and September 30, 2020 as well as the twelve-month periods ended December 31, 2020 and December 31, 2019.
($ in millions, except per share amounts)
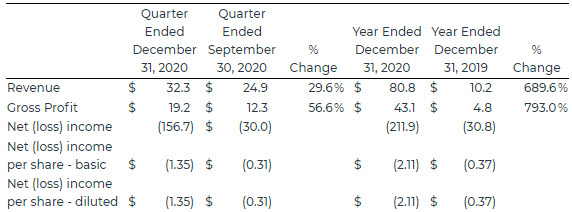
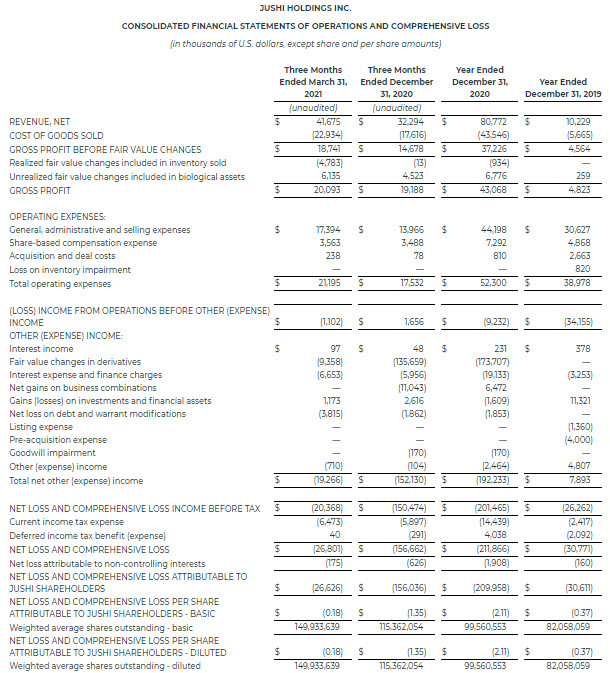
Revenue in the fourth quarter of 2020 (“Q4 2020”) increased 29.6% to $32.3 million, compared to $24.9 million in the third quarter of 2020 (“Q3 2020”). For the full year 2020, revenue increased 689.6% to $80.8 million, compared to $10.2 million in 2019. For the fourth quarter 2020, the increase in revenue was primarily driven by strong organic growth at the Company’s BEYOND/HELLOTM stores in Pennsylvania and Illinois, an increase in cultivation and manufacturing activity due to the acquisition of Pennsylvania Medical Solutions, LLC (“PAMS”), a Pennsylvania grower-processor permit holder, and increased operating activity at its Nevada cultivation and processing facility. For the full year 2020, the increase in revenue was primarily driven by the expansion of the Company’s retail portfolio, including the addition of nine new stores during the year, and an increase in wholesale revenue, driven by the acquisition of PAMS and increased operating activity at its Nevada cultivation and processing facility.
Gross profit in Q4 2020 was $19.2 million, or 59.4% of revenue compared to $12.3 million or 49.2% of revenue in Q3 2020. For the full year 2020, gross profit was $43.1 million, or 53.3% of revenue, compared to $4.8 or 47.2% of revenue in 2019. The increases in gross profit was primarily driven by the increase in revenue and an increase in unrealized gains on biological assets.
Q4 2020 net loss was $156.7 million, or $1.35 per diluted share, compared to a net loss of $30.0 million, or $0.31 per diluted share, in Q3 2020. The $126.7 million increase in net loss in the fourth quarter was driven primarily by an increase in the derivative warrant liability prompted by the rise of the Company’s share price and an increase in operating expenses, partially offset by higher revenue and gross profit. Full year 2020 net loss was $211.9 million, or $2.11 per diluted share, compared to a net loss of $30.8 million, or $0.37 per diluted share, in 2019.
Adjusted EBITDA1 in Q4 2020 was $2.6 million, or 8.2% of revenue, compared to Adjusted EBITDA of $1.9 million, or 7.7% of revenue, in Q3 2020. Adjusted EBITDA1 for the full year 2020 was a negative $2.6 million. The improvement in Adjusted EBITDA was driven by strong organic growth at the Company’s BEYOND/HELLOTM stores in Pennsylvania and Illinois, and initial contributions from its recently acquired subsidiary Pennsylvania Medical Solutions, LLC (“PAMS”), a Pennsylvania grower-processor permit holder, partially offset by an increase in staffing related costs in advance of certain assets becoming fully operational and revenue generating.
Financial Results for the First Quarter Ended March 31, 2021
The following is a tabular summary and commentary of revenue, gross profit, net income (loss) and net income (loss) per share for the three-month period ended March 31, 2021 and the three-month period ended December 31, 2020.
($ in millions, except per share amounts)
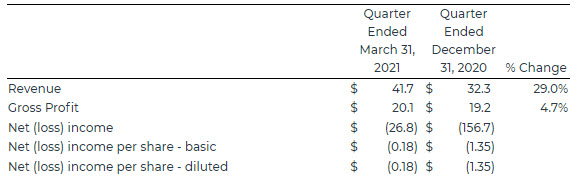
Revenue in the first quarter of 2021 (“Q1 2021”) increased 29.0% to $41.7 million, compared to $32.3 million in Q4 2020. The 29.0% increase in revenue was driven primarily by solid revenue growth at the Company’s BEYOND/HELLOTM stores in Pennsylvania and Illinois, early revenue contributions from its Virginia retail operations and increased operating activity at its PAMS and Nevada facilities.
Gross profit in Q1 2021 was $20.1 million, or 48.2% of revenue, compared to $19.2 million, or 59.4% of revenue in Q4 2020. The increase in gross profit was primarily driven by strong revenue growth at the Company’s BEYOND/HELLOTM stores in Pennsylvania and Illinois, early revenue contributions from its Virginia retail operations and increased operating activity at its PAMS and Nevada facilities.
Q1 2021 net loss was $26.8 million, or $0.18 per diluted share, compared to a net loss of $156.7 million, or $1.35 per diluted share, in Q4 2020. The $129.9 million improvement in net loss in the first quarter was driven primarily by a decrease in fair value losses on derivative liabilities, along with higher revenue and gross profit.
Adjusted EBITDA1 in Q1 2021 was $3.0 million, compared to Adjusted EBITDA $2.6 million in Q4 2020. The increase in Adjusted EBITDA on a sequential quarterly basis was driven by higher revenues and gross profit, partially offset by an increase in staffing related expenses in advance of new store openings, the increase in staffing at our Ohio facility before the commencement of operations, and the expansion of our Pennsylvania and Virginia grower-processor assets grower-processor assets.
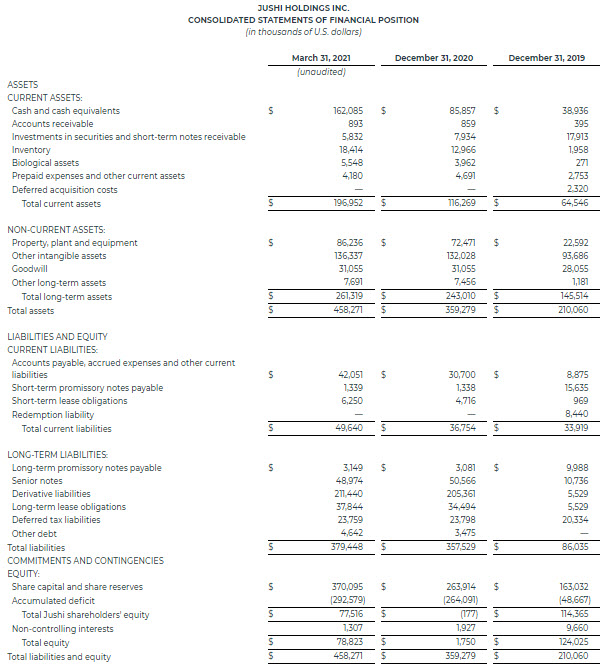
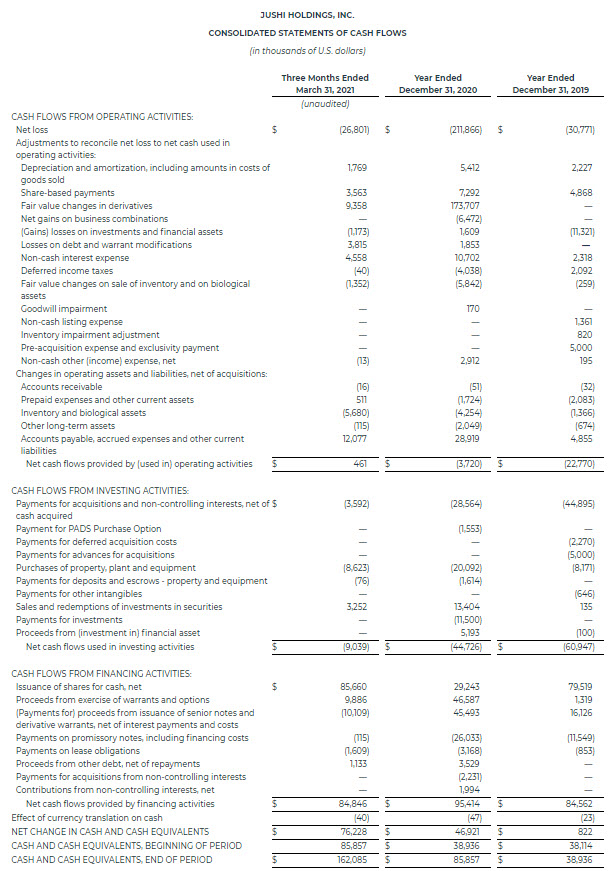
Balance Sheet and Liquidity
As of March 31, 2021, the Company had $167.9 million of cash and short-term investments. Total current assets of $197.0 million and current liabilities of $49.6 million as of March 31, 2021. Net working capital at the end of March 31, 2021 was $147.3 million. The Company incurred approximately $9 million in cash capital expenditures during the first quarter of 2021. The Company expects to incur a total of approximately $90 million to $110 million in capital expenditures during 2021, subject to market conditions and regulatory changes. As of March 31 2021, the Company had $82.4 million principal amount of total debt, excluding leases and property, plant and equipment financing obligations.
Outlook
For the second quarter of 2021, we expect revenues to be between $45 to $48 million and Adjusted EBITDA to be between $4 to $6 million.
 Jim Cacioppo, the CEO, Chairman and Founder of Jushi Holdings Inc.
We continue to believe our strong momentum, enviable footprint, and solid balance sheet positions the Company well to execute on its current plans and drive long-term shareholder value through 2021 and beyond.
The Company’s MD&A and consolidated financial statements for the first quarter ended March 31, 2021, along with all previous public filings of the Company, may be found on SEDAR at www.SEDAR.com.
Conference Call and Webcast Information
Management will host a conference call and audio webcast on Wednesday, June 2nd at 9:00 a.m. ET to answer questions about the Company’s operational and financial highlights. The dial-in numbers for the conference call are +1-877-407-0792 (U.S. Toll-Free) or +1-201-689-8263 (International). Please dial in 10 to 15 minutes prior to the start time of the conference call and an operator will register your name and organization.
The conference call will also be available via webcast, which can be accessed through the Investor Relations section of Jushi’s website, http://ir.jushico.com/.
For interested individuals unable to join the conference call, an audio webcast replay will be available and can be accessed on Jushi’s Investor Relations site, http://ir.jushico.com/.
About Jushi Holdings Inc.
We are a vertically integrated cannabis company led by an industry-leading management team. In the United States, Jushi is focused on building a multi-state portfolio of branded cannabis-derived assets through opportunistic acquisitions, distressed workouts, and competitive applications. Jushi strives to maximize shareholder value while delivering high-quality products across all levels of the cannabis ecosystem. For more information, please visit jushico.com/, twitter.com/wearejushi and beyond-hello.com/.
JUSHI HOLDINGS INC.
RECONCILIATION OF NON-IFRS FINANCIAL MEASURES
EBITDA and Adjusted EBITDA are financial measures that are not defined under IFRS. Management believes EBITDA is a useful measure to assess the performance of the Company as it provides meaningful operating results by excluding the effects of expenses that are not reflective of our operating business performance. Management defines EBITDA as net income (loss), or “earnings”, before interest, income taxes, depreciation and amortization. We believe Adjusted EBITDA is a useful measure to assess the performance of the Company as it provides more meaningful operating results by excluding the effects of expenses that are not reflective of the Company’s operating business performance and other one-time or non- recurring expenses. We define Adjusted EBITDA as EBITDA before: (i) fair value changes included in inventory sold and fair value changes included in biological assets; (ii) share-based compensation expense; (iii) fair value changes in derivatives; (iv) net gains on business combinations; (v) gains and losses on investments and financial assets; (vi) net loss on debt and warrant modification; (vii) gains and losses on legal settlements; (viii) pre-acquisition expense; (ix) listing expense; and (x) goodwill impairment. The financial measures noted above are metrics that have been adjusted from the IFRS net income (loss) measure in an effort to provide readers with a normalized metric in making comparisons more meaningful across the cannabis industry, as well as to remove non-recurring, irregular and one-time items that may otherwise distort the IFRS net income measure. Other companies in the Jushi’s industry may calculate this measure differently, limiting their usefulness as comparative measures.
Adjusted EBITDA is not a recognized performance measure under IFRS, does not have a standardized meaning and therefore may not be comparable to similar measures presented by other issuers. Adjusted EBITDA is included as a supplemental disclosure because we believe that such measurement provides a better assessment of the Company’s operations on a continuing basis by eliminating certain material non-cash items and certain other adjustments we believe are not reflective of the Company’s ongoing operations and performance. Adjusted EBITDA has limitations as an analytical tool as it excludes from net income as reported interest, tax, depreciation, non-cash expenses, RTO expense, other income, grow cost expensed for biological assets and unsold inventory, and the non-cash fair value effects of accounting for biological assets and inventories. Because of these limitations, Adjusted EBITDA should not be considered as the sole measure of the Company’s performance and should not be considered in isolation from, or as a substitute for, analysis of the Company’s results as reported under IFRS. The most directly comparable measure to Adjusted EBITDA calculated in accordance with IFRS is operating income (loss).
Jushi includes a store in the same-store base if the store is operational for two consecutive full quarters. A store is not included in same-store sales if it is closed for one week or longer, such as for business interruption, remodeling, during the stated period. Same-store sales growth is primarily a result of changes in the number of customer transactions and changes in the average transaction size. Jushi’s same-store sales growth is primarily impacted by the expansion of its brand awareness, continued menu innovation and the use technology. Jushi’s same-store sales growth is also impacted by external factors including the macro-economic environment that could affect consumer spending.