![]()
ScottsMiracle-Gro Announces Record Second Quarter Results; Sales Increase 32% Driven by Strong Demand in Both Major Segments
Sales guidance for Hawthorne increases; U.S. Consumer continues to exceed expectations
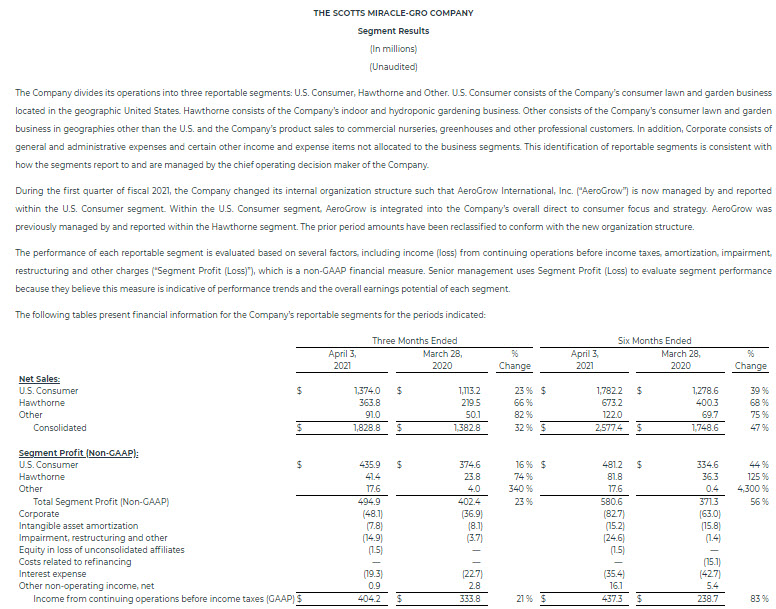
- Hawthorne sales rise 66% in Q2 with strong growth in all product categories
- U.S. Consumer sales rise 23% driven by continued increases in consumer demand
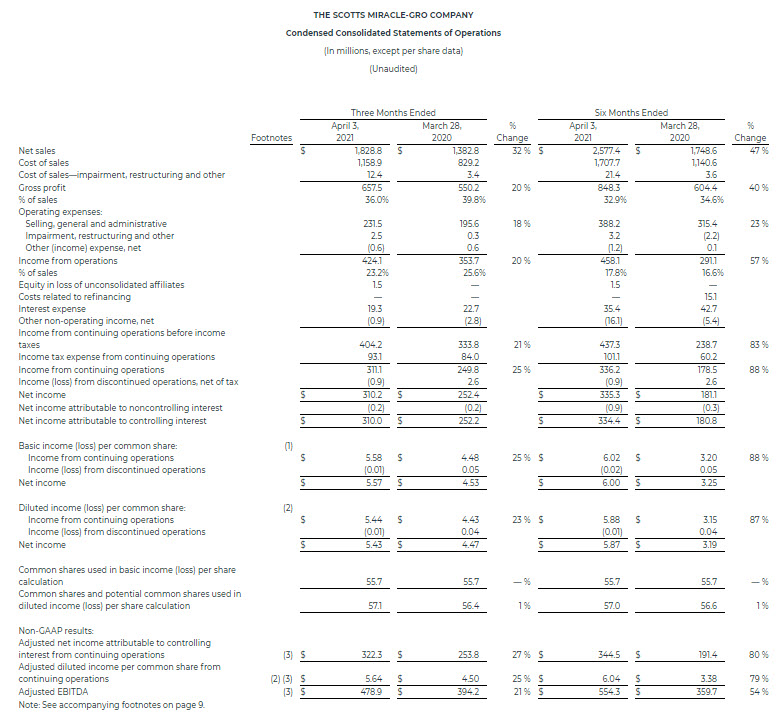
- GAAP EPS: $5.44 versus $4.43; Non-GAAP adjusted EPS of $5.64 versus $4.50
- Company affirms plan to increase pricing to offset continued commodity pressure
MARYSVILLE, Ohio, May 05, 2021 (GLOBE NEWSWIRE) — The Scotts Miracle-Gro Company (NYSE: SMG), the world’s leading marketer of branded consumer lawn and garden as well as indoor and hydroponic growing products, today announced company-wide sales increased 32 percent in its fiscal second quarter driven by strong volume growth in both major business segments.
For the quarter ended April 3, 2021, GAAP earnings from continuing operations were $5.44 per share compared with $4.43 per share in the prior year. Non-GAAP adjusted earnings, which exclude impairment, restructuring and other non-recurring items, and are the basis of the Company’s financial guidance, were $5.64 per share compared with $4.50 a year ago.
On a fiscal year-to-date basis entering May, consumer purchases of the Company’s lawn and garden products at its largest four retailers in the U.S. increased over 20 percent from the same period a year ago. The Company said consumer purchases entering May were up double digits in every major product category and all regions of the U.S.
“The record level of consumer demand we have seen for our lawn and garden products is greater than we expected and may provide upside to the updated guidance we provided for our U.S. Consumer business in early April,” said Jim Hagedorn, chairman and chief executive officer. “Consumers told us entering the season that they intended to stay engaged with lawn and garden and, so far, that is exactly what they are doing. Retailer support for the category remains strong as we enter a period of challenging year-over-year comparisons.
We also continue to exceed expectations at Hawthorne as we reported our fifth consecutive quarter of sales growth in excess of 60 percent and another month of strong results in April. Given the current momentum of this business, we feel comfortable once again increasing our sales guidance for Hawthorne to a range of 30 to 40 percent growth on a fiscal year basis.
 Jim Hagedorn, chairman and chief executive officer
Second quarter details
For the fiscal second quarter, the Company reported sales of $1.83 billion, up 32 percent from $1.38 billion a year earlier. U.S. Consumer segment sales increased 23 percent to $1.37 billion. Sales for the Hawthorne segment increased 66 percent to $363.8 million. Due to the Company’s fiscal calendar, the second quarter of 2021 ended six days later than the second quarter of fiscal 2020. The shift had a sales impact of approximately $122.5 million within the lawn and garden business, impacting the U.S. Consumer and Other segments.
The company-wide gross margin rate was 36.0 percent on a GAAP basis and 36.6 percent on a non-GAAP adjusted basis compared with a rate of 39.8 percent and 40.0 percent, respectively, a year ago. As expected, segment mix was a significant driver of the decline given the growth of the lower-margin Hawthorne segment. Higher commodity and distribution costs also negatively impacted the rate but were partially offset by improved fixed cost leverage.
“The margin pressure we are experiencing from higher commodity and distribution costs is expected again in the third quarter and should begin to moderate with year-over-year pricing that takes effect in the fourth quarter,” said Cory Miller, senior vice president and interim chief financial officer. “Given cost pressures and other investments necessary to keep pace with recent growth trends, we have communicated to our retail partners our intention to increase prices of our consumer lawn and garden products by mid- to high-single digits effective in August. A similar price increase was implemented at Hawthorne in recent weeks.”
Selling, general and administrative expenses (SG&A) increased 18 percent to $231.5 million due to increased marketing investment and higher accruals related to variable compensation.
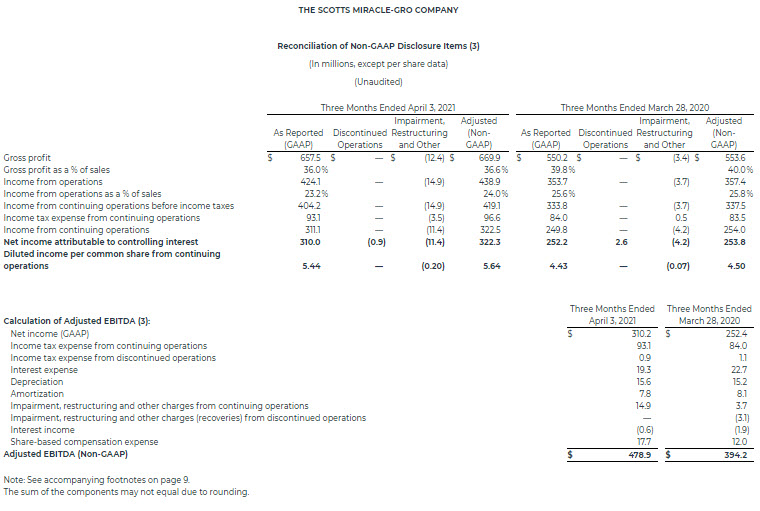
On a company-wide basis, GAAP income from continuing operations was $311.1 million, or $5.44 per diluted share, compared with $249.8 million, or $4.43 per diluted share, for the second quarter of fiscal 2020. These results include impairment, restructuring and other non-recurring items. Excluding these items, non-GAAP adjusted earnings were $322.3 million, or $5.64 per diluted share, compared with $253.8 million, or $4.50 per diluted share, last year.
Year-to-date details
For the first six months of fiscal 2021, the Company reported sales of $2.58 billion, up 47 percent from $1.75 billion a year earlier. U.S. Consumer segment sales increased 39 percent to $1.78 billion. Sales for the Hawthorne segment increased 68 percent to $673.2 million. The shift in the fiscal calendar contributed approximately $176.9 million. This impact will reverse in the second half of the year, which will have six fewer days than the second half of fiscal 2020.
The company-wide gross margin rate was 32.9 percent on a GAAP basis and 33.7 percent on a non-GAAP adjusted basis compared with a rate of 34.6 percent and 34.8 percent, respectively, a year ago. Selling, general and administrative expense (SG&A) increased 23 percent to $388.2 million.
“The increases we have seen in SG&A for the year are due primarily to planned increases in marketing investment as well as higher year-over-year variable compensation,” Miller said. “However, the compensation expense is driven by the timing of recognition and is expected to decline considerably in the third quarter compared with the prior year, bringing the total year-over-year SG&A down to a level closer to where we expect on a full-year basis.”
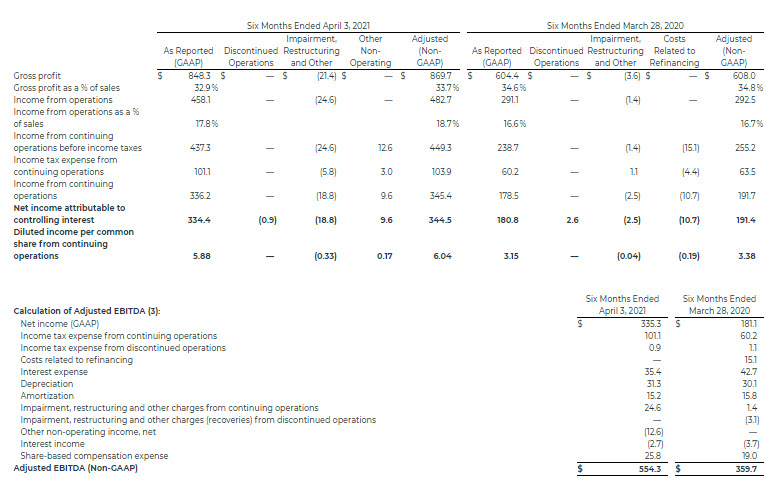
On a company-wide basis, GAAP income from continuing operations was $336.2 million, or $5.88 per diluted share, compared with $178.5 million, or $3.15 per diluted share, for the first six months of fiscal 2020. Excluding impairment, restructuring and other non-recurring items, non-GAAP adjusted earnings were $344.5 million, or $6.04 per diluted share, compared with $191.4 million, or $3.38 per diluted share, last year.
Full-year outlook
The Company now expects Hawthorne sales to increase 30 to 40 percent for fiscal 2021. While it reaffirmed its sales outlook for the U.S. Consumer segment of 4 to 6 percent growth, the Company said sales growth in the segment continues to trend above that level and believes upside to be possible on a full-year basis. The gross margin rate is now expected to decline 175 to 225 basis points with the added downward pressure due to higher commodity and distribution costs. All other aspects of its fiscal 2021 guidance were reaffirmed, although management said it expected to provide an update on its full-year expectations in early June.
“We continue to see tremendous momentum in all aspects of the business, and we are extremely optimistic in our ability to drive another year of record results,” Hagedorn said. “Obviously, consumer activity in May is extremely important, and it is historically one of the most critical months of the lawn and garden season. That said, we are encouraged by the level of consumer participation we have been seeing so far this season and are optimistic that consumers will remain engaged throughout the season.”
Conference Call and Webcast Scheduled for 9 a.m. ET Today, May 5
The Company will discuss results during a webcast and conference call today at 9:00 a.m. ET. To participate in the conference call, please call 1-800-289-0438 (Confirmation Code: 5691876). A replay of the call can be heard by calling 1-888-203-1112. The replay will be available for 15 days. A live webcast of the call and the press release will be available on the Company’s investor relations website at http://investor.scotts.com. An archive of the press release and any accompanying information will remain available for at least a 12-month period.
About ScottsMiracle-Gro
With approximately $4.1 billion in sales, the Company is one of the world’s largest marketers of branded consumer products for lawn and garden care. The Company’s brands are among the most recognized in the industry. The Company’s Scotts®, Miracle-Gro® and Ortho® brands are market-leading in their categories. The Company’s wholly-owned subsidiary, The Hawthorne Gardening Company, is a leading provider of nutrients, lighting and other materials used in the indoor and hydroponic growing segment. For additional information, visit us at www.scottsmiraclegro.com.
THE SCOTTS MIRACLE-GRO COMPANY
Footnotes to Preceding Financial Statements
(1) Basic income (loss) per common share amounts are calculated by dividing income (loss) attributable to controlling interest from continuing operations, income (loss) from discontinued operations and net income (loss) attributable to controlling interest by the weighted average number of common shares outstanding during the period.
(2) Diluted income (loss) per common share amounts are calculated by dividing income (loss) attributable to controlling interest from continuing operations, income (loss) from discontinued operations and net income (loss) attributable to controlling interest by the weighted average number of common shares, plus all potential dilutive securities (common stock options, performance shares, performance units, restricted stock and restricted stock units) outstanding during the period.
(3) Reconciliation of Non-GAAP Measures
Use of Non-GAAP Measures
To supplement the financial measures prepared in accordance with U.S. generally accepted accounting principles (“GAAP”), the Company uses non-GAAP financial measures. The reconciliations of these non-GAAP financial measures to the most directly comparable financial measures calculated and presented in accordance with GAAP are shown in the tables above. These non-GAAP financial measures should not be considered in isolation from, or as a substitute for or superior to, financial measures reported in accordance with GAAP. Moreover, these non-GAAP financial measures have limitations in that they do not reflect all the items associated with the operations of the business as determined in accordance with GAAP. Other companies may calculate similarly titled non-GAAP financial measures differently than the Company, limiting the usefulness of those measures for comparative purposes.
In addition to GAAP measures, management uses these non-GAAP financial measures to evaluate the Company’s performance, engage in financial and operational planning and determine incentive compensation because it believes that these measures provide additional perspective on and, in some circumstances are more closely correlated to, the performance of the Company’s underlying, ongoing business.
Management believes that these non-GAAP financial measures are useful to investors in their assessment of operating performance and the valuation of the Company. In addition, these non-GAAP financial measures address questions routinely received from analysts and investors and, in order to ensure that all investors have access to the same data, management has determined that it is appropriate to make this data available to all investors. Non-GAAP financial measures exclude the impact of certain items (as further described below) and provide supplemental information regarding operating performance. By disclosing these non-GAAP financial measures, management intends to provide investors with a supplemental comparison of operating results and trends for the periods presented. Management believes these measures are also useful to investors as such measures allow investors to evaluate performance using the same metrics that management uses to evaluate past performance and prospects for future performance. Management views free cash flow as an important measure because it is one factor used in determining the amount of cash available for dividends and discretionary investment. Management views free cash flow productivity as a useful measure to help investors understand the Company’s ability to generate cash.
Exclusions from Non-GAAP Financial Measures
Non-GAAP financial measures reflect adjustments based on the following items:
- Impairments, which are excluded because they do not occur in or reflect the ordinary course of the Company’s ongoing business operations and their exclusion results in a metric that provides supplemental information about the sustainability of operating performance.
- Restructuring and employee severance costs, which include charges for discrete projects or transactions that fundamentally change the Company’s operations and are excluded because they are not part of the ongoing operations of its underlying business, which includes normal levels of reinvestment in the business.
- Costs related to refinancing, which are excluded because they do not typically occur in the normal course of business and may obscure analysis of trends and financial performance. Additionally, the amount and frequency of these types of charges is not consistent and is significantly impacted by the timing and size of debt financing transactions.
- Discontinued operations and other unusual items, which include costs or gains related to discrete projects or transactions and are excluded because they are not comparable from one period to the next and are not part of the ongoing operations of the Company’s underlying business.
The tax effect for each of the items listed above is determined using the tax rate and other tax attributes applicable to the item and the jurisdiction(s) in which the item is recorded.
Definitions of Non-GAAP Financial Measures
The reconciliations of non-GAAP disclosure items include the following financial measures that are not calculated in accordance with GAAP and are utilized by management in evaluating the performance of the business, engaging in financial and operational planning, the determination of incentive compensation, and by investors and analysts in evaluating performance of the business:
Adjusted gross profit: Gross profit excluding impairment, restructuring and other charges / recoveries.
Adjusted income (loss) from operations: Income (loss) from operations excluding impairment, restructuring and other charges / recoveries.
Adjusted income (loss) from continuing operations before income taxes: Income (loss) from continuing operations before income taxes excluding impairment, restructuring and other charges / recoveries and costs related to refinancing.
Adjusted income tax expense (benefit) from continuing operations: Income tax expense (benefit) from continuing operations excluding the tax effect of impairment, restructuring and other charges / recoveries and costs related to refinancing.
Adjusted income (loss) from continuing operations: Income (loss) from continuing operations excluding impairment, restructuring and other charges / recoveries and costs related to refinancing, each net of tax.
Adjusted net income (loss) attributable to controlling interest from continuing operations: Net income (loss) attributable to controlling interest excluding impairment, restructuring and other charges / recoveries, costs related to refinancing and discontinued operations, each net of tax.
Adjusted diluted income (loss) per common share from continuing operations: Diluted net income (loss) per common share from continuing operations excluding impairment, restructuring and other charges / recoveries and costs related to refinancing, each net of tax.
Adjusted EBITDA: Net income (loss) before interest, taxes, depreciation and amortization as well as certain other items such as the impact of the cumulative effect of changes in accounting, costs associated with debt refinancing and other non-recurring or non-cash items affecting net income (loss). The presentation of adjusted EBITDA is intended to be consistent with the calculation of that measure as required by the Company’s borrowing arrangements, and used to calculate a leverage ratio (maximum of 4.50 at April 3, 2021) and an interest coverage ratio (minimum of 3.00 for the twelve months ended April 3, 2021).
Free cash flow: Net cash provided by (used in) operating activities reduced by investments in property, plant and equipment.
Free cash flow productivity: Ratio of free cash flow to net income (loss).
For the three and six months ended April 3, 2021, the following items were adjusted, in accordance with the definitions above, to arrive at the non-GAAP financial measures:
- The World Health Organization recognized a novel strain of coronavirus (“COVID-19”) as a public health emergency of international concern on January 30, 2020 and as a global pandemic on March 11, 2020. In response to the COVID-19 pandemic, the Company has implemented additional measures intended to both protect the health and safety of its employees and maintain its ability to provide products to its customers, including (i) requiring a significant part of its workforce to work from home, (ii) monitoring its employees for COVID-19 symptoms, (iii) making additional personal protective equipment available to its operations team, (iv) requiring all manufacturing and warehousing associates to take their temperatures before beginning a shift, (v) modifying work methods and schedules of its manufacturing and field associates to create distance or add barriers between associates, consumers and others, (vi) expanding cleaning efforts at its operation centers, (vii) modifying attendance policies so that associates may elect to stay home if they have symptoms, (viii) prioritizing production for goods that are more essential to its customers and (ix) implementing an interim premium pay allowance for certain associates in its field sales force or working in manufacturing or distribution centers. During the three and six months ended April 3, 2021, the Company incurred costs of $12.3 million and $21.0 million, respectively, in the “Cost of sales—impairment, restructuring and other” line in the Condensed Consolidated Statements of Operations and incurred costs of $2.6 million and $3.2 million, respectively, in the “Impairment, restructuring and other” line in the Condensed Consolidated Statements of Operations associated with the COVID-19 pandemic primarily related to premium pay. These direct and incremental costs were excluded from the Company’s non-GAAP financial measures because they are not comparable from one period to the next and are not expected to be part of the ongoing operations of the Company’s underlying business.
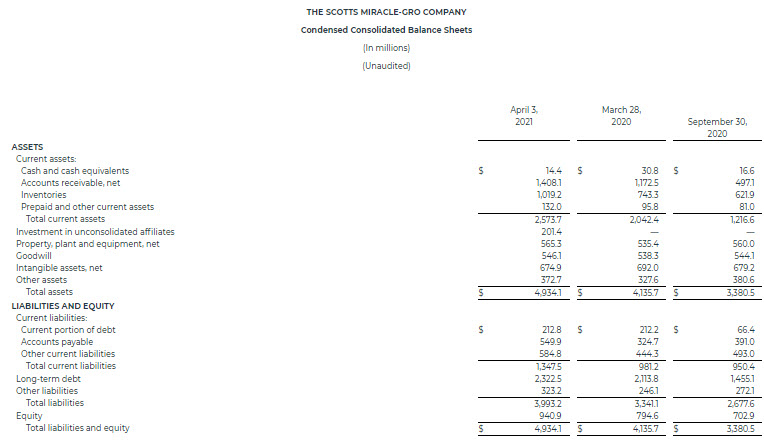
- On December 31, 2020, pursuant to the terms of the Contribution and Unit Purchase Agreement between the Company and Alabama Farmers Cooperative, Inc. (“AFC”), the Company acquired a 50% equity interest in the Bonnie Plants business through a newly formed joint venture with AFC (“Bonnie Plants, LLC”) in exchange for a cash payment of $100.7 million, forgiveness of the Company’s outstanding loan receivable with AFC and termination of the Company’s options to increase its economic interest in the Bonnie Plants business. The Company’s loan receivable with AFC, which was previously recognized in the “Other assets” line in the Condensed Consolidated Balance Sheets, had a carrying value of $66.4 million on December 31, 2020 and the Company recognized a gain of $12.5 million during the first quarter of fiscal 2021 to write-up the value of the loan to its closing date fair value in the “Other non-operating income, net” line in the Condensed Consolidated Statements of Operations. The Company’s interest in Bonnie Plants, LLC had an initial fair value of $202.9 million and is recorded in the “Investment in unconsolidated affiliates” line in the Condensed Consolidated Balance Sheets. The Company’s interest is accounted for using the equity method of accounting, with the Company’s proportionate share of Bonnie Plants, LLC earnings subsequent to December 31, 2020 reflected in the Condensed Consolidated Statements of Operations.
For the three and six months ended March 28, 2020, the following items were adjusted, in accordance with the definitions above, to arrive at the non-GAAP financial measures:
- During the three and six months ended March 28, 2020, the Company incurred costs of $3.1 million in the “Cost of sales—impairment, restructuring and other” line in the Condensed Consolidated Statements of Operations and incurred costs of $0.7 million in the “Impairment, restructuring and other” line in the Condensed Consolidated Statements of Operations associated with the COVID-19 pandemic primarily related to premium pay.
- During the three and six months ended March 28, 2020, the Company received zero and $2.6 million, respectively, from the final settlement of escrow funds related to a previous Hawthorne acquisition that was recognized in the “Impairment, restructuring and other” line in the Condensed Consolidated Statements of Operations.
- On October 23, 2019, the Company redeemed all of its outstanding 6.000% Senior Notes for a redemption price of $412.5 million, comprised of $0.5 million of accrued and unpaid interest, $12.0 million of redemption premium, and $400.0 million for outstanding principal amount. The $12.0 million redemption premium was recognized in the “Costs related to refinancing” line in the Condensed Consolidated Statements of Operations during the first quarter of fiscal 2020. Additionally, the Company had $3.1 million in unamortized bond issuance costs associated with the 6.000% Senior Notes, which were written-off during the first quarter of fiscal 2020 and were recognized in the “Costs related to refinancing” line in the Condensed Consolidated Statements of Operations.
- The Company recognized insurance recoveries of $1.5 million related to the previously disclosed legal matter In re Morning Song Bird Food Litigation during the three and six months ended March 28, 2020 in the “Income (loss) from discontinued operations, net of tax” line in the Condensed Consolidated Statements of Operations.
Forward Looking Non-GAAP Measures
In this earnings release, the Company presents its outlook for fiscal 2021 non-GAAP adjusted EPS. The Company does not provide a GAAP EPS outlook, which is the most directly comparable GAAP measure to non-GAAP adjusted EPS, because changes in the items that the Company excludes from GAAP EPS to calculate non-GAAP adjusted EPS, described above, can be dependent on future events that are less capable of being controlled or reliably predicted by management and are not part of the Company’s routine operating activities. Additionally, due to their unpredictability, management does not forecast the excluded items for internal use and therefore cannot create or rely on a GAAP EPS outlook without unreasonable efforts. The timing and amount of any of the excluded items could significantly impact the Company’s GAAP EPS. As a result, the Company does not provide a reconciliation of guidance for non-GAAP adjusted EPS to GAAP EPS, in reliance on the unreasonable efforts exception provided under Item 10(e)(1)(i)(B) of Regulation S-K.