![]()
Village Farms International Reports Fourth Quarter and Year End 2021 Financial Results: Fourth Quarter Consolidated EPS of $0.03 Per Share, Net Income of $2.1 Million and Consolidated Adjusted EBITDA(1) of $5.3 Million
- Canadian Cannabis Generates 13th Consecutive Quarter of Positive Adjusted EBITDA, Pure Sunfarms Remains Top-Selling Brand of Dried Flower in Ontario, Alberta and BC
- U.S. Cannabis2 and Village Farms Fresh (Produce) Each Generate Positive Adjusted EBITDA
VANCOUVER, BC, March 1, 2022 /PRNewswire/ – Village Farms International, Inc. (“Village Farms” or the “Company”) (NASDAQ: VFF) today announced its financial results for the three months and year ended December 31, 2021. All figures are in U.S. dollars unless otherwise indicated.
Management Commentary
In the fourth quarter, we once again saw strong year-over-year growth in sales and adjusted EBITDA, with positive adjusted EBITDA contributions from each of our Canadian Cannabis, US Cannabis and Village Farms Fresh (Produce) businesses for the second consecutive quarter.
 Michael DeGiglio, CEO, Village Farms
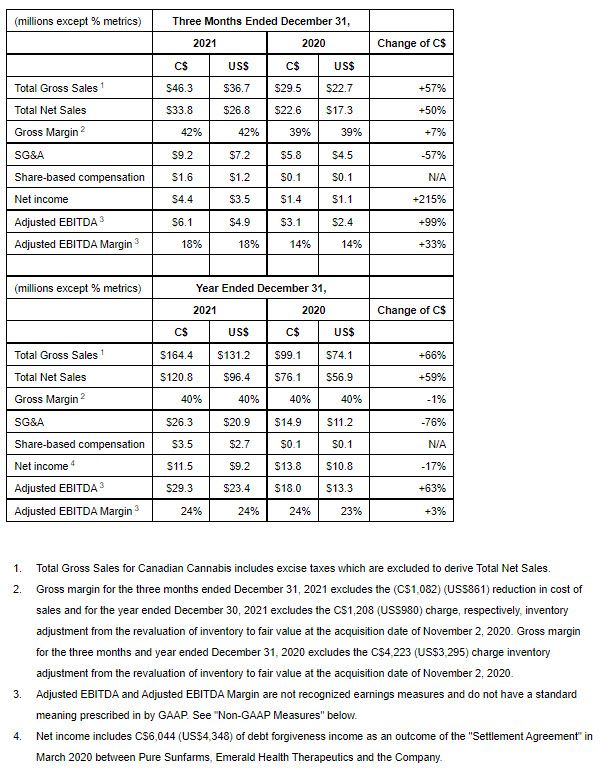
Our results were driven by the continued strong performance of our Canadian cannabis operations, with Pure Sunfarms’ leading market share in the dried flower category and successful new product introductions, as well as the first partial quarter contribution of Rose LifeScience in Quebec, driving a 50% year-over-year increase in net revenue and 99% increase in adjusted EBITDA. Gross margin remained at the top end of our target range at 42%. With expanded production capacity and robust product strategy, as well as the significant opportunities created by the acquisition of Quebec-based Rose and anticipated receipt of EU-GMP certification, we believe 2022 promises to take the scale and profitability of our Canadian cannabis operations to a new level.
“The performance of our Canadian cannabis operations throughout 2021 contributed to a year that saw Village Farms overall deliver growth in revenue and adjusted EBITDA of 58% and 89%, respectively, supported by the profitable contribution of Balanced Health Botanicals since its acquisition in August, and the improvement in market pricing for Village Farms Fresh in the second half of the year. 2021 was also a year in which we meaningfully moved forward our growth strategies – in high and low-THC cannabis, in North America and abroad – which we expect will position Village Farms to build on our current momentum for the next phase of profitable, outsized growth – in 2022 and beyond.”
1. Adjusted EBITDA is a non-GAAP measure. See “Non-GAAP Measures” for a definition and reconciliation of Adjusted EBITDA to net income (loss), the nearest comparable measurement under GAAP.
2. U.S. Cannabis segment refers to our U.S.-based CBD, cannabinoid and hemp businesses.
Fourth Quarter Highlights
With the acquisitions of Balanced Health and Rose LifeScience in 2021, we now organize our operating segments into Canadian Cannabis (Pure Sunfarms; Rose LifeScience); U.S. Cannabis (Balanced Health and VF Hemp); Village Farms Fresh (Produce) and VF Clean Energy. For Consolidated Results see below.
Cannabis
- Total cannabis sales (Canadian and US) increased 168% year-over-year to $34.4 million, and represented 47% of total consolidated sales, increasing from 27% for the fourth quarter of 2020; and,
- Total cannabis adjusted EBITDA increased 183% year-over-year to $6.8 million.
Canadian Cannabis (Pure Sunfarms and Rose LifeScience)
- Canadian Cannabis achieved strong year-over-growth in total net sales and retail branded sales, while generating margins at the high end of the Company’s stated target range:
- 50% year-over-year increase in total net sales and 118% year-over-year increase in Retail Branded Sales;
- 42% gross margin, above the Company’s stated target range of 30 to 40%;
- 99% year-over-year increase in adjusted EBITDA, marking the 13th consecutive quarter of positive adjusted EBITDA;
- Pure Sunfarms remained the top-selling brand* of dried flower products in key markets:
- In Ontario (by kilograms sold and dollars sold) for the fourth quarter 2021 and for the period since Retail Branded sales launch in October 2019;
- In Alberta** for the fourth quarter 2021 and monthly since October 2020 (by dollars sold);
- In British Columbia** for the fourth quarter 2021 and monthly since October 2020 (by dollars sold);
- Pure Sunfarms launched 23 new SKUs across four product categories; and,
- Village Farms acquired 70% ownership of privately-held, Québec-based, Rose LifeScience, adding a substantial presence in the Province of Québec as a cannabis supplier, producer and commercialization expert.
* Based on OCS market data for the quarter ended December 31, 2021.
** Market share performance data cited has been calculated by Pure Sunfarms from sales information provided by Buddi retail store data from over 300 retailers across Alberta and British Columbia as of December 31, 2021.
*** Market share performance and data cited has been calculated by Pure Sunfarms from sales information provided by OCS as of December 31, 2021.
Canadian Cannabis (Pure Sunfarms and Rose LifeScience) Financial Summary for the Three Months and Year Ended December 31, 2021 and December 31, 2020 (Before Village Farms’ Proportionate Share)
Canadian Cannabis (Pure Sunfarms) Sales Composition by Product Group
U.S. Cannabis (Balanced Health Botanicals and VF Hemp)
- Net sales of $7.5 million for the three months ended December 31, 2021;
- Gross margin of 71% for the fourth quarter of 2021;
- Adjusted EBITDA of $1.9 million for the fourth quarter of 2021; and,
- Expanded its product portfolio with the launch of its innovative Synergy Collection, developed to enhance the multitude of benefits offered by the hemp plant and other ingredients beyond CBD alone.
Village Farms Fresh (Produce)
- Continued improved financial results with an 11% year-over-year increase in sales and positive Adjusted EBITDA of $1.1 million for the three months ended December 31, 2021.
Village Farms’ Consolidated Financial Summary for the Three Months and Year Ended December 31, 2021 and December 31, 2020 and Corporate Highlights
Our Response to the Ongoing Coronavirus Pandemic
In March 2020, the World Health Organization declared the outbreak of the COVID-19 virus a global pandemic. This outbreak continues to cause major disruptions to businesses and markets worldwide as the virus continues to spread. Several countries as well as certain states and cities within the United States and Canada have enacted temporary closures of businesses, issued quarantine or shelter-in-place orders and taken other restrictive measures. In response to the COVID-19 pandemic, the Company implemented safety protocols and procedures to protect its employees, its subcontractors, and its customers. These protocols take into consideration guidance from state and local government agencies as well as the Centers for Disease Control and Prevention and other public health authorities.
In April 2020, the Government of Canada announced the Canada Emergency Wage Subsidy (“CEWS”) to help Canadian businesses to keep employees on the payroll in response to the challenges posed by the COVID-19 pandemic. During 2021 and 2020, Pure Sunfarms determined that it met the employer eligibility criteria and applied for the CEWS and received C$871 and C$2,470 of wage subsidies during the years ended December 31, 2021 and 2020, respectively.
As of February 25, 2022, all of the Company’s operations are operating normally, however, the extent to which COVID-19 and the related global economic crisis affect the Company’s business, results of operations and financial condition, will depend on future developments that are highly uncertain and cannot be predicted, including the scope and duration of the pandemic and any recovery period, future actions taken by governmental authorities, central banks and other third parties (including new financial regulation and other regulatory reform) in response to the pandemic, and the effects on our produce, clients, vendors and employees. Village Farms continues to service its customers amid uncertainty and disruption linked to COVID-19 and is actively managing its business to respond to the impact.
Summary Statutory Results
(in thousands of U.S. Dollars unless otherwise indicated)
- For the year ended December 31, 2021, Pure Sunfarms is fully consolidated in the financial results of the Company. For the period August 16, 2021 to December 31, 2021, Balanced Health is fully consolidated in the financial results of the Company. For the period November 15, 2021 to December 31,2021, Village Farms’ share of Rose LifeScience’s financial results are fully consolidated in the financial results of the Company with the minority non-controlling interest presented in net loss attributable to non-controlling interests, net of tax.
- For the period January 1, 2020 to November 1, 2020, Village Farms’ share of Pure Sunfarms earnings are reflected in equity in earnings of unconsolidated entities. For the period of November 2, 2020 to December 31, 2020, Pure Sunfarms is fully consolidated in the financial results of the Company.
- Adjusted EBITDA is not a recognized earnings measure and does not have a standardized meaning prescribed by GAAP. Therefore, Adjusted EBITDA may not be comparable to similar measures presented by other issuers. See “Non-GAAP Measures” for a definition and reconciliation of Adjusted EBITDA to net income (loss), the nearest comparable measurement under GAAP. Management believes that Adjusted EBITDA is a useful supplemental measure in evaluating the performance of the Company. Adjusted EBITDA includes the Company’s majority non-controlling interest in Pure Sunfarms through November 1, 2020 and 100% interest since November 2, 2020, 70% interest in Rose LifeScience since acquisition, 65% interest in VFH and 60% interest in AVGGH.
Discussion of Financial Results
A discussion of our consolidated results for the years ended December 31, 2021 and 2020 is included below. The consolidated results include all four of our operating segments, produce, cannabis-Canada, cannabis-U.S. and clean energy, along with all public company expenses. The remaining 41.3% interest in Pure Sunfarms was acquired by Village Farms on November 2, 2020; from November 2, 2020 through December 31, 2020 and the year ended December 31, 2021, the operating results of Pure Sunfarms are consolidated in our Consolidated Statements of Income (Loss), and for the period January 1, 2020 to November 1, 2020, Pure Sunfarms’ results are included in income from equity method investments in our Consolidated Statements of Income (Loss). Village Farms acquired 100% of Balanced Health on August 16, 2021 and their operating results are consolidated in our Consolidated Statements of Income (Loss) for August 16, 2021 to December 31, 2021. The Company acquired 70% of Rose LifeScience on November 15, 2021 and their operating results are consolidated in our Consolidated Statements of Income (Loss) and the minority interest is presented in Net Income (Loss) Attributable to Non-controlling Interests, Net of Tax for November 15, 2021 to December 31, 2021.
Under “Cannabis Segment Results – Canada”, we also present a discussion of the operating results of Pure Sunfarms, before any allocation to Village Farms, which were not consolidated in our financial results for the period of January 1, 2020 to November 1, 2020 and were only consolidated in our results for the year ended December 31, 2021 and the period November 2, 2020 to December 31, 2020. As a result of the Pure Sunfarms Acquisition, Pure Sunfarms recognized an increase in the fair value of its inventory on-hand on the acquisition date, resulting in a $980 charge to cost of sales for the year ended December 31, 2021 and a $3,295 charge to cost of sales for the year ended December 31, 2020. This is a non-cash accounting charge to cost of sales and should be adjusted for when analyzing the actual operational results of Pure Sunfarms. The “Cannabis Segment Results – Canada” also include the operating results of Rose LifeScience, which are consolidated in our financial results and the minority interest is presented in Net Income (Loss) Attributable to Non-controlling Interests, Net of Tax for November 15, 2021 to December 31, 2021.
Under “Cannabis Segment Results – U.S.”, we present a discussion of the operating results of Balanced Health for the period of August 16, 2021 to December 31, 2021, which were consolidated in the Company’s financial results for the year ended December 31, 2021. We also present VF Hemp which is a joint venture and their results are included in “(Losses) Income from Equity Method Investments” for the year ended December 31, 2021.
CONSOLIDATED RESULTS
Year Ended December 31, 2021 Compared to Year Ended December 31, 2020
Sales
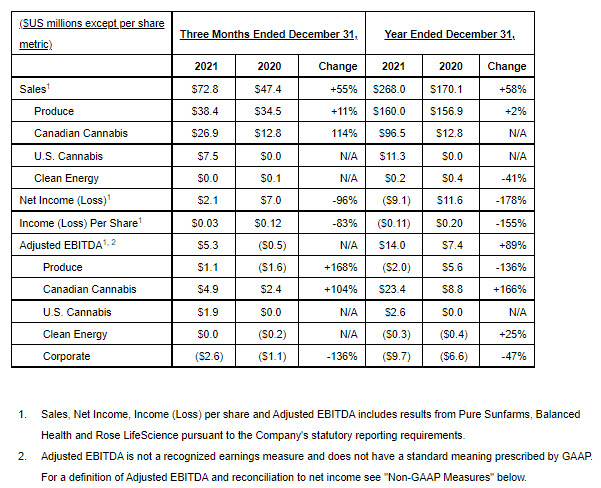
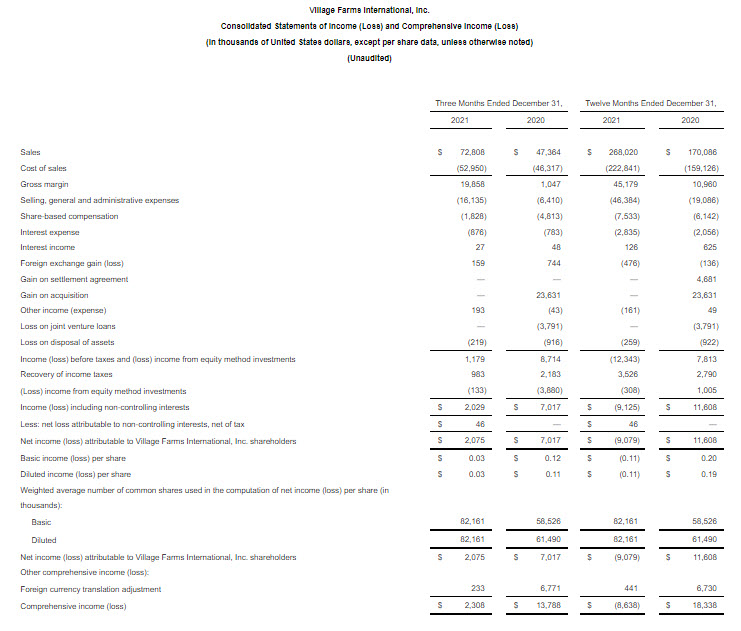
Sales for the year ended December 31, 2021 increased $97,934, or 58%, to $268,020 compared to $170,086 for the year ended December 31, 2020. The increase in sales was primarily due to an increase in Canadian cannabis sales of $83,656, produce supply partner revenues of $15,897 and U.S. cannabis sales of $11,345, partially offset by our own produce revenues of ($13,011). The increase from Canadian cannabis sales in 2021 as compared to 2020 was primarily due to the inclusion of sales from Pure Sunfarms that was acquired on November 2, 2020 and as such, 2021 includes twelve months of sales and 2020 includes two months of sales. In addition, the sales from Rose LifeScience which was acquired on November 15, 2021 are also included in the Canadian cannabis sales for the year ended December 31, 2021. The sales of Pure Sunfarms and Rose LifeScience were fully consolidated in our financial results from their acquisition dates. The produce supply partner revenue increase in 2021 was mostly due to higher volumes, with a 30% increase in tomato pounds sold, a 12% increase in pepper pounds sold, a 31% increase in cucumber pieces sold and a 79% increase in mini cucumber pounds sold. The increase from U.S. cannabis sales in 2021 was due to the acquisition of Balanced Health on August 16, 2021. The decrease in our own produce revenues was due primarily to a (19%) decrease in the average selling price of our produced tomatoes as a result of a market supply overage in commodity tomatoes and an overall slowdown of retail purchases for the year ended December 31, 2021 as compared to the year ended December 31, 2020.
The average selling price for all tomato pounds sold decreased (13%) for the year ended December 31, 2021 compared to the year ended December 31, 2020, which was driven by a decrease in the average selling price of commodity items, particularly beefsteak and tomatoes-on-the-vine (“TOV”). Pepper prices decreased (12%), cucumber prices increased 6% and mini cucumber prices decreased (14%) for the year ended December 31, 2021 as compared to the year ended December 31, 2020.
Cost of Sales
Cost of sales for the year ended December 31, 2021 increased $63,715, or 40%, to $222,841 from $159,126 for the year ended December 31, 2020, due primarily to an increase in Canadian cannabis cost of sales of $48,638, produce supply partner costs of $13,288 and U.S. cannabis cost of sales of $3,398, partially offset by a decrease in our own produce production costs of ($2,094).
The increase from Canadian cannabis cost of sales was primarily due to the inclusion of twelve months of costs for Pure Sunfarms in 2021 as compared to costs for the period of November 2, 2020 to December 31, 2020, along with the post-acquisition costs from Rose LifeScience from November 15, 2021 through December 31, 2021. The increase in year-over-year produce supply partner costs was due to higher volumes of tomatoes, peppers and cucumbers which also drove higher freight costs and the increase from U.S. cannabis cost of sales was due to the inclusion of the cost of sales of Balanced Health from its acquisition date of August 16, 2021. The reduction in our own produce production costs was driven by lower costs at our Texas facilities, primarily due to a decrease in the cost per pound produced as facility management’s cost saving efforts were realized in 2021 despite supply chain issues that worsened during the pandemic.
Gross Margin
Gross margin for the year ended December 31, 2021 increased $34,219, or 312%, to $45,179 from $10,960 for the year ended December 31, 2020. The positive increase in gross margin for 2021 as compared to 2020 was driven by an increase of $35,018 from the Canadian cannabis segment, $7,947 from the U.S. cannabis segment and $2,609 from our produce supply partners, partially offset by lower gross margin from our own produce production of ($10,917).
Selling, General and Administrative Expenses
Selling, general and administrative expenses for the year ended December 31, 2021 increased $27,298, or 143%, to $46,384 or 17% of sales from $19,086 or 11% of sales for the year ended December 31, 2020. The increase between comparable years was primarily due to the inclusion of the selling, general and administrative expenses of the Canadian and U.S. cannabis businesses post-acquisition along with an increase in public company costs such as acquisition fees related to Balanced Health and Rose LifeScience, investor relations, legal and regulatory expenses, listing fees and the costs of Sarbanes-Oxley compliance.
Share-Based Compensation
Share-based compensation expenses for the year ended December 31, 2021 was $7,533 from $6,142 for the year ended December 31, 2020. The incremental increase in share-based compensation is primarily related to the vesting of performance share grants in 2021 that were earned in the Canadian cannabis segment as Pure Sunfarms’ management participated in the Company’s compensation plan for the entirety of 2021 as compared to two months in 2020.
Gain on Settlement Agreement
On March 2, 2020, pursuant to the settlement agreement with Emerald, Emerald transferred to the Company 2.5% of additional equity in Pure Sunfarms. The Company determined the fair value of the equity received from Emerald to be $4,681. The Company recorded this amount as a gain on settlement agreement.
Gain on Acquisition
On November 2, 2020, the Company consummated the Pure Sunfarms Acquisition, pursuant to which the Company acquired 36,958,500 Common Shares of Pure Sunfarms owned by Emerald and increased the Company’s ownership of Pure Sunfarms to 100%. The shares were acquired for a total aggregate purchase price of C$79.9 million (US$60.0 million), satisfied through a C$60.0 million (US $45.0 million) cash payment and the Promissory Note. The acquisition is a business combination and has been accounted for in accordance with the measurement and recognition provisions of ASC Topic 805, Business Combinations. ASC Topic 805 requires that the purchase consideration be allocated to the assets acquired and liabilities assumed in a business combination based upon their estimated fair values at the date of acquisition. As such, the Company recognized a gain of $23,631 due to the revaluation of its previously held investment in Pure Sunfarms to its fair value at acquisition date.
Loss on Disposal of Assets
The Company recognized a loss on disposal of assets of ($259) and ($922) for the years ended December 31, 2021 and 2020, respectively. The loss in 2021 is primarily due to writing off the DutchCanGrow minority investment and the loss in 2020 is primarily due to shutting down two of the VFCE generators and fully depreciating the assets in 2020.
Loss on Joint Venture Loans
The Company recognized a loss on joint venture loans of ($3,791) for the year ended December 31, 2020. The loss in 2020 is due to writing down the inventory of VF Hemp to its net realizable value in the fourth quarter of 2020. As a result of the inventory write-down, the Company recognized an impairment of ($3,791) on the outstanding grid loan with VF Hemp.
(Losses) Income from Equity Method Investments
Our share of losses from our equity method investments for the year ended December 31, 2021 was ($308) compared to earnings of $1,005 for the year ended December 31, 2020. Our share of income for Pure Sunfarms was presented in income from equity method investments from January 1, 2020 to November 1, 2020. Village Farms began fully consolidating operating results of Pure Sunfarms on November 2, 2020. VF Hemp was presented in (losses) from equity method investments in both years ended December 31, 2021 and 2020. For information regarding the results of operations from our joint ventures, see “Non-GAAP Measures – Reconciliation of U.S. GAAP Results to Proportionate Results” below.
Net Loss Attributable to Non-controlling Interests, Net of Tax
For the year ended December 31, 2021, the net loss attributable to non-controlling interests, net of tax was $46. Due to the acquisition of 70% of Rose LifeScience, the Company fully consolidates the results of Rose LifeScience in the Company’s Consolidated Statements of Income (Loss) and Comprehensive Income (Loss). The 30% retained interest is presented as net loss attributable to non-controlling interests, net of tax per GAAP.
Net (Loss) Income Attributable to Village Farms International Inc.
Net (loss) for the year ended December 31, 2021 was ($9,079) in comparison to net income of $11,608 for the year ended December 31, 2020. Net (loss) was driven by a decrease in our operating loss of ($8,738) for the year ended December 31, 2021 as compared to an operating loss of ($14,268) for the year ended December 31, 2020. The 2020 net income was significantly enhanced by the gain in acquisition of Pure Sunfarms of $23,631 and the gain on the settlement agreement with Emerald of $4,681, partially offset by the write-off of ($3,791) of the Company’s loan to VF Hemp and loss on disposal of VFCE assets of ($922).
Adjusted EBITDA
Adjusted EBITDA for the year ended December 31, 2021 increased $6,601 to $14,012 from $7,411 for the year ended December 31, 2020, primarily as a result of improved operating income of the Canadian and U.S. cannabis segments, partially offset by a higher operating loss of the produce segment and an increase in corporate expenses. See the reconciliation of Adjusted EBITDA to net income in “Non-GAAP Measures—Reconciliation of Net Earnings to Adjusted EBITDA”.
CANNABIS SEGMENT RESULTS – CANADA
The Canadian cannabis segment currently consists of Pure Sunfarms and Rose LifeScience. Pure Sunfarms’ comparative analysis are based on the consolidated results of Pure Sunfarms for the years ended December 31, 2021 and 2020 and the three month periods ending December 31, 2021 and 2020 and September 30, 2021, not accounting for the percentage owned by Village Farms. The Canadian cannabis segment also includes the operating results of Rose LifeScience from November 15, 2021 to December 31, 2021, which are consolidated in our results for the year ended December 31, 2021 with the minority interest presented in Net Income (Loss) Attributable to Non-controlling Interests, Net of Tax. See “Non-GAAP Measures – Reconciliation of U.S. GAAP Results to Proportionate Results” for a presentation of the Canadian cannabis segment’s proportionate results for years ended December 30, 2021 and December 31, 2020.
Year Ended December 31, 2021 Compared to Year Ended December 31, 2020
Sales
Canadian cannabis net sales for the years ended December 31, 2021 and 2020 was $96,434 (C$120,829) and $56,875 (C$76,060), respectively, an increase of 70%. The year over year change is comprised of a 94% increase in sales to provincial boards (branded sales) and a 2% increase in wholesale sales (non-branded sales). The net sales also include the addition of Rose LifeScience net sales of $1,460 (C$1,865) from November 15, 2021 to December 31, 2021, which mostly consist of sales of their own products and commission-based sales.
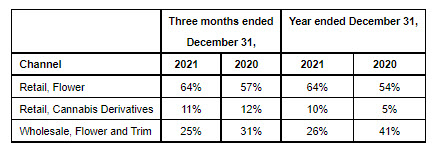
For the year ended December 31, 2021, 64% of revenue was generated from branded flower and pre-roll sales, with an additional 10% from branded cannabis derivative products, which Pure Sunfarms launched in September 2020. For the year ended December 31, 2020, 54% of revenue was generated from branded flower and pre-roll sales, with an additional 5% from branded cannabis derivative products. Non-branded sales accounted for 26% of revenue in 2021 as compared to 41% in 2020, as Pure Sunfarms continued to transition from a predominantly wholesale market supplier in 2019 to a mixed branded and wholesale market supplier in 2020 and 2021.
On a combined basis, the net average selling price of branded flower and pre-roll formats did not change from 2020 to 2021, due primarily to a greater volume of pre-roll sales in 2021 which has a higher selling price than flower. Excluding pre-roll formats, the average net selling price of branded flower decreased by (4%) in 2021 as the retail market experienced general price compression. The net average selling price of bulk non-branded flower and trim decreased by (57%) largely due to an increased volume of trim sales which are sold at a lower selling price relative to non-branded flower.
Cost of Sales
Cost of sales for the years ended December 31, 2021 and 2020 was $59,224 (C$74,216) and $37,525 (C$49,978), respectively, an increase of 58%. The increase for 2021 as compared to 2020 was primarily driven by a 109% volume increase of branded flower and pre-roll sales which has an incremental cost of production to manufacture over bulk product sold in the wholesale channel and $1,120 (C$1,428) in cost of sales for Rose LifeScience in 2021. During 2020, the cost of sales also includes a $1,069 (C$1,412) inventory write down for distillate oil purchased from third party extraction companies for which the market value has dropped since the initial purchase as well as a $3,295 (C$4,223) charge in the fourth quarter of 2020 resulting from the revaluation of inventory to fair value at the acquisition date of Pure Sunfarms.
Gross Margin
Gross margin for the year ended December 31, 2021 increased $17,860 (C$20,531) or 92% to $37,210 (C$46,613) from $19,350 (C$26,082) for the year ended December 31, 2020. Gross margin as a percentage of net revenue of 39% in 2021 was higher than gross margin of 34% in 2020. The gross margin improved in 2021 as increased output of production had a favorable impact on cost of production and offset the reduction in the selling price of flower and additional costs associated with the manufacture of branded cannabis derivative products in 2021.
Selling, General and Administrative Expenses
Selling, general and administrative expenses for the year ended December 31, 2021 increased 87% to $20,937 (C$26,278) or 22% of 2021 net sales from $11,207 (C$14,936) for the year ended December 31, 2020 or 20% of 2020 net sales. The increase in 2021 was primarily due to higher Health Canada regulatory fees, which are based on cannabis sales, Rose LifeScience expenses of $491 (C$626), as well as incremental year over year expenses for sales, marketing and additional headcount to support the growth of the Canadian cannabis segment.
Share-Based Compensation
Share-based compensation for the years ended December 31, 2021 and 2020 were $2,738 (C$3,462) and $61 (C$78) respectively. The 2021 increase reflects the vesting of performance share grants in 2021 that were earned in the Canadian cannabis segment as Pure Sunfarms’ management participated in the Company’s compensation plan for the entirety of 2021 as compared to two months in 2020.
Net Income
Net income for the years ended December 31, 2021 and 2020 was $9,165 (C$11,498) and $10,857 (C$13,789) respectively. The decrease between years is mainly driven by the 2020 gain on settlement of net liabilities from the Pure Sunfarms Settlement Agreement, partially offset by the increase in operating income of the Canadian cannabis segment for the year ended December 31, 2021 as compared to the year ended December 31, 2020.
Adjusted EBITDA
Adjusted EBITDA was $23,415 (C$29,264) for the year ended December 31, 2021 and $13,329 (C$17,960) for the year ended December 31, 2020. The increase of $10,086 (C$11,304), or 76%, is primarily attributable to significant revenue growth while improving gross margin between years partially offset by a slight increase in selling, general and administrative expenses as a percentage of net sales in 2021 as compared to 2020. See the reconciliation of Adjusted EBITDA to net income in “Non-GAAP Measures—Reconciliation of Net Earnings to Adjusted EBITDA”.
Three Months Ended December 31, 2021 Compared to Three Months Ended December 31, 2020
Sales
Canadian cannabis net sales for the three months ended December 31, 2021 were $26,821 (C$33,810) as compared to $17,303 (C$22,527) for the three months ended December 31, 2020. The net sales increase includes Rose LifeScience net sales of $1,460 (C$1,865) from November 15, 2021 through December 31, 2021 and was primarily comprised of a 57% increase in branded sales and a 10% increase in non-branded sales. For the three months ended December 31, 2021, 65% of revenue was generated from branded flower and pre-rolls and 11% of revenue from Cannabis Derivative Products as compared to 84% of revenue from branded flower and pre-rolls and 8% of revenue from Cannabis Derivative Products for the three months ended December 31, 2020. For the three months ended December 31, 2021, non-branded sales represented 24% of revenues compared to 8% for the three months ended December 31, 2020. The Canadian cannabis segment continues to experience strong demand for its branded flower amidst what continues to be a congested market. The increase in non-branded sales was largely attributable to the certain opportunistic transactions available in the current period not available in the comparison period.
Cost of Sales
Canadian cannabis cost of sales for the three months ended December 31, 2021 was $14,791 (C$18,662) as compared to $13,821 (C$17,951) for the three months ended December 31, 2020. As a result of the Pure Sunfarms Acquisition, Pure Sunfarms recognized a difference between the fair value and book value of inventory on the acquisition date, resulting in a $861 (C$1,082) reduction to cost of sales in the fourth quarter of 2021 and a $3,295 (C$4,223) charge to cost of sales in the fourth quarter of 2020. This is a non-cash accounting charge to cost of sales and should be adjusted for when analyzing the actual operational results of the Canadian cannabis segment. The increase in cost of sales between the periods includes $1,120 (C$1,428) of Rose LifeScience post-acquisition costs of sales. Excluding the non-cash adjustment described above, the cost of sales as a percentage of net revenue deceased due to increased yields in cultivation which has had a downward impact on the cost per gram.
Gross Margin
Gross margin for the three months ended December 31, 2021 was $12,030 (C$15,148) or 45% of net sales as compared to $3,482 (C$4,576) or 20% of net sales for the three months ended December 31, 2020. This increase in gross margin was largely due to an increase in branded sales and non-cash accounting reduction to cost of sales in the fourth quarter of 2021 along with the non-cash accounting charge to cost of sales in the fourth quarter of 2020. Gross margin as a percent of net sales without the non-accounting charge was 42% for the fourth quarter of 2021 and 39% for the fourth quarter of 2020.
Selling, General and Administrative Expenses
Canadian cannabis selling, general and administrative expenses for the three months ended December 31, 2021 were $7,277 (C$9,184), or 27% of sales compared to $4,476 (C$5,846), or 26% of sales for the three months ended December 31, 2020. The increase in selling, general and administrative expenses as a percentage of sales for the three months ended December 31, 2021 in comparison to the three months ended December 31, 2020 was primarily due to an increase in headcount to support the growth of sales and inclusion of Rose LifeScience expenses of $491 (C$626).
Share-Based Compensation
Share-based compensation expenses for the three months ended December 31, 2021 were $1,267 (C$1,602) as compared to $61 (C$78) for the three months December 31, 2020. The 2021 increase reflects the vesting of performance share grants in 2021 that were earned in the Canadian cannabis segment by Pure Sunfarms’ management.
Net Income
Canadian cannabis net income for the three months ended December 31, 2021 was $3,514 (C$4,441) as compared to net loss of $1,086 (C$1,379) for the three months ended December 31, 2020. The higher net income between periods was primarily driven by a higher operating income in the fourth quarter of 2021 as compared to the fourth quarter of 2020.
Adjusted EBITDA
Adjusted EBITDA for the three months ended December 31, 2021 and 2020 was $4,894 (C$6,147) and $2,376 (C$3,083), respectively, representing an increase of 106%. The higher adjusted EBITDA between periods was primarily driven by an increase of branded sales and improved yields from cultivation which lowered the cost of sales as a percentage of revenue.
Three Months Ended December 31, 2021 Compared to Three Months Ended September 30, 2021
Sales
Canadian cannabis net sales for the three months ended December 31, 2021 were $26,821 (C$33,810) as compared to $27,393 (C$34,508) for the three months ended September 30, 2021. The fourth quarter of 2021 includes Rose LifeScience post-acquisition sales of $1,460 (C$1,865). The sequential net sales decrease of 2% was comprised of a 7% increase in branded sales offset with a 33% decrease in non-branded sales. For the three months ended December 31, 2021, 65% of revenue was generated from branded flower and pre-rolls and 11% of revenue from branded oils, edibles and vapes (“Cannabis Derivative Products”) as compared to 58% of revenue from branded flower and pre-rolls and 6% of revenue from Cannabis Derivative Products for the three months ended September 30, 2021. For the three months ended December 31, 2021, non-branded sales represented 24% of revenues compared to 36% for the three months ended September 30, 2021. The Canadian cannabis segment continues to experience strong demand for its branded flower amidst what continues to be a congested market. The decrease in non-branded sales was largely attributable to specific opportunistic transactions that were available in the previous quarter.
Cost of Sales
Canadian cannabis cost of sales for the three months ended December 31, 2021 was $14,791 (C$18,662) as compared to $14,244 (C$17,947) for the three months ended September 30, 2021. The fourth quarter of 2021 includes Rose LifeScience post-acquisition sales of $1,120 (C$1,428). As a result of the Pure Sunfarms Acquisition, Pure Sunfarms recognized a difference between the fair value and book value of inventory on the acquisition date, resulting in a $861 (C$1,082) reduction to cost of sales in the fourth quarter of 2021 and a $1,217 (C$1,534) reduction to cost of sales in the third quarter of 2021. This is a non-cash accounting charge to cost of sales and should be adjusted for when analyzing the actual operational results of the Canadian cannabis segment. The slight increase in cost of sales between the periods was driven by the inclusion of the Rose LifeScience cost of sales in the current period.
Gross Margin
Gross margin for the three months ended December 31, 2021 was $12,030 (C$15,148) or 45% of net sales as compared to $13,149 (C$16,561) or 48% for the three months ended September 30, 2021. The decrease in gross margin percentage between sequential periods was largely due to a decrease in non-branded sales and the inclusion of Rose LifeScience. However, this decrease was somewhat offset by increased yields that continued to be experienced throughout 2021 which in turn lowers our cost of production and positively impacts gross margin.
Selling, General and Administrative Expenses
Canadian cannabis selling, general and administrative expenses for the three months ended December 31, 2021 were $7,277 (C$9,184), or 27% of sales compared to $5,324 (C$6,702), or 19% of sales for the three months ended September 30, 2021. The increase in selling, general and administrative expenses as a percentage of sales for the three months ended December 31, 2021 in comparison to the three months ended September 30, 2021 was due to an increase in brand and commercial activities as well as higher workforce and related employee expenses.
Share-Based Compensation
Share-based compensation expenses for the three months ended December 31, 2021 were $1,267 (C$1,602) as compared to $186 (C$234) for the three months September 30, 2021. The fourth quarter increase reflects the vesting of performance share grants in 2021 that were earned in the Canadian cannabis segment by Pure Sunfarms’ management.
Net Income
Canadian cannabis net income for the three months ended December 31, 2021 was $3,514 (C$4,441) as compared to net income of $5,287 ($6,661) for the three months ended September 30, 2021. The lower net income between periods was primarily driven by lower non-branded sales along with higher selling, general and administrative expenses and share-based compensation expense.
Adjusted EBITDA
Adjusted EBITDA for the three months ended December 31, 2021 and September 30, 2021 was $4,894 (C$6,147) and $8,627 (C$10,867), respectively, representing a decrease of 43%. The lower adjusted EBITDA between periods was primarily driven by a lower amount of non-branded sales and an increase in selling, general and administrative expenses for the three months ended December 31, 2021.
CANNABIS SEGMENT RESULTS – UNITED STATES
The U.S. cannabis segment currently consists of Balanced Health and VF Hemp. For the year ended December 30, 2021, U.S. cannabis financial results are based on the consolidated results of Balanced Health from the closing date of the acquisition of August 16, 2021, as the results of Balanced Health from August 16, 2021 through December 31, 2021 are consolidated in the Company’s results. VF Hemp is a joint venture, and its results are included in “Equity in Earnings of Unconsolidated Entities” for the year ended December 31, 2021.
Sales
U.S. cannabis net sales for the period of August 16, 2021 to December 31, 2021 were $11,345. Over 99% of sales are generated in the United States and gross sales are composed of 79% from e-commerce sales, 15% from retail sales, 3% from shipping income and 1% from bulk sales. The loyalty program impact contributed 2% of net sales as loyalty program customers generate loyalty points that may be used when purchasing Balanced Health products.
Cost of Sales
U.S. cannabis cost of sales for the period of August 16, 2021 to December 31, 2021 were $3,398. Cost of sales are attributed directly to e-commerce, retail and bulk cost of sales with all other costs categorized within other manufacturing costs of sales including expenses such as warehouse expenses, freight and shipping supplies.
Gross Margin
U.S. cannabis gross margin for the period of August 16, 2021 to December 31, 2021 was $7,947 or 70%.
Selling, General and Administrative Expenses
U.S. cannabis selling general and administrative expenses for the period of August 16, 2021 to December 31, 2021 was $5,604 or 49% of sales. As the U.S. cannabis business derives a significant number of sales through its online technology platforms, the primary expense categories within selling, general and administrative include sales and marketing, merchant fees, e-commerce support and IT services.
Share-Based Compensation
U.S. cannabis share-based compensation for the period of August 16, 2021 to December 31 2021 was $158. The share-based compensation is due to the cost of performance-based stock options for U.S. cannabis management.
Net Income
U.S. cannabis net income for the period of August 16, 2021 to December 31, 2021 was $2,200 due primarily to the gross margin of 70%.
Adjusted EBITDA
U.S. cannabis adjusted EBITDA for the period of August 16, 2021 to December 31, 2021 was $2,363 and is due primarily to the operating profit of Balanced Health offset by the loss from VF Hemp which is presented in equity losses from unconsolidated entities in the Consolidated Statements of Income (Loss).
Non-GAAP Measures
References in this MD&A to “Adjusted EBITDA” are to earnings (including the equity earnings of the joint ventures, Pure Sunfarms and VFH) before interest, taxes, depreciation, and amortization (“EBITDA”), as further adjusted to exclude foreign currency exchange gains and losses on translation of long-term debt, unrealized gains on the changes in the value of derivative instruments, share-based compensation, gains and losses on asset sales and the other adjustments set forth in the table below. Adjusted EBITDA is a measure of operating performance that is not recognized under GAAP and does not have a standardized meaning prescribed by GAAP. Therefore, Adjusted EBITDA may not be comparable to similar measures presented by other issuers. Investors are cautioned that Adjusted EBITDA should not be construed as an alternative to net income or loss determined in accordance with GAAP as an indicator of our performance. Management believes that Adjusted EBITDA is an important measure in evaluating the historical performance of the Company because it excludes non-recurring and other items that do not reflect our business performance.
We also present Adjusted EBITDA, earnings per share and diluted earnings per share on a proportionate segment basis. Each of the components of Adjusted EBITDA, on a proportionate segment basis (which include our proportionate share of the joint ventures, Pure Sunfarms and VF Hemp, which were accounted for as equity method investments, as well as the proportionate share of Rose LifeScience, in respect of which we have a 70% interest and the remaining 30% is accounted for as a non-controlling interest), are presented in the table “Reconciliation of U.S. GAAP Results to Proportionate Results” below. We believe that the ability of investors to assess our overall performance may be improved by the disclosure of proportionate segment Adjusted EBITDA, income (loss) per share and diluted income (loss) per share by providing disclosure of our results that relate specifically to our share of our investments, given that our equity-accounted joint ventures represented a significant percentage of our net income in 2020 and 2019. We have presented a similar measure in 2021, which accounts for VF Hemp and Rose LifeScience on a proportionate basis, for comparability purposes.
Reconciliation of Consolidated Net Income to Adjusted EBITDA
- For the year ended December 31, 2021, Pure Sunfarms is fully consolidated in the financial results of the Company. For the period August 16, 2021 to December 31, 2021, Balanced Health is fully consolidated in the financial results of the Company. For the period November 15, 2021 to December 31,2021, Village Farms’ share of Rose LifeScience’s financial results are fully consolidated in the financial results of the Company.
- For the period January 1, 2020 to November 1, 2020, Village Farms’ share of Pure Sunfarms earnings is reflected in income from equity method investments. For the period of November 2, 2020 to December 31, 2020, Pure Sunfarms is fully consolidated in the financial results of the Company.
- See “Results of Operations – Consolidated Results – Gain on Acquisition” above.
- See “Results of Operations – Consolidated Results – Gain on Settlement Agreement” above.
- The purchase price adjustment primarily reflects the non-cash accounting charge resulting from the revaluation of Pure Sunfarms’ inventory to fair value at the acquisition date.
- The GAAP treatment of our equity earning of Pure Sunfarms is different than under IFRS. Under GAAP, the Emerald shares held in escrow are not considered issued until paid for pursuant to the GAAP concept of ‘hypothetical liquidation’. As a result, under GAAP, our ownership percentage for March through November of 2019 was higher than its economic interest of 50%. Accordingly, for those periods with a higher deemed ownership percentage, we received a higher allocation of profits and losses during the periods in which there were outstanding escrow shares that were not yet paid for by Emerald. The effective profit and loss allocation – on a weighted average basis in 2020 was 64.8%, and in 2019 was 57.9%.
- Adjusted EBITDA is not a recognized earnings measure and does not have a standardized meaning prescribed by GAAP. Therefore, Adjusted EBITDA may not be comparable to similar measures presented by other issuers. Management believes that Adjusted EBITDA is a useful supplemental measure in evaluating the performance of the Company because it excludes non-recurring and other items that do not reflect our business performance. Adjusted EBITDA includes the Company’s majority non-controlling interest in Pure Sunfarms through November 1, 2020 and 100% interest since November 2, 2020, 70% interest in Rose LifeScience since acquisition, 65% interest in VFH and 60% interest in AVGGH.
Reconciliation of U.S. GAAP Results to Proportionate Results
The following tables are a reconciliation of the GAAP results to the proportionate results (which include our proportionate share of the equity method joint ventures of Pure Sunfarms, VF Hemp and AVGGH and 70% ownership of Rose LifeScience, in respect of which we have a 70% interest and the remaining 30% is accounted for as a non-controlling interest). Pure Sunfarms was a joint venture until the Company acquired 100% ownership on November 2, 2020. The Company acquired 70% of Rose LifeScience on November 15, 2021. The tables reflect the full statements of income for Pure Sunfarms, VFH and AVGGH multiplied by the ownership percentage of the Company (versus presenting the results of these equity method joint ventures in (Losses) Earnings from Equity Method Investments) and the full statements of income for Rose LifeScience for November 15, 2021 through December 31, 2021 multiplied by the 70% ownership of the Company (versus presenting 100% of the results in the consolidated statement of income and the minority interest in in Net Income (Loss) Attributable to Non-controlling Interests, Net of Tax):
- The adjusted consolidated financial results have been adjusted to include our share of revenues and expenses from Pure Sunfarms, Rose LifeScience and VF Hemp on a proportionate accounting basis, on which management bases its operating decisions and performance evaluation. GAAP does not allow for the inclusion of the joint ventures on a proportionate basis. These results include additional non-GAAP measures such as Adjusted EBITDA. The adjusted results are not generally accepted measures of financial performance under GAAP. Our method of calculating these financial performance measures may differ from other companies and accordingly, they may not be comparable to measures used by other companies.
- Adjusted EBITDA is not a recognized earnings measure and does not have a standardized meaning prescribed by GAAP. Therefore, Adjusted EBITDA may not be comparable to similar measures presented by other issuers. Management believes that Adjusted EBITDA is a useful supplemental measure in evaluating the performance of the Company because it excludes non-recurring and other items that do not reflect our business performance. Consolidated Adjusted EBITDA includes our majority non-controlling interest Pure Sunfarms, our 65% interest in VFH and our 60% interest in AVGGH.
This press release is intended to be read in conjunction with the Company’s Consolidated Financial Statements (“Financial Statements”) and Management’s Discussion & Analysis (“MD&A”) for the three and year ended December 31, 2021 in the Company Form 10-K, which will be filed on EDGAR (www.sec.gov/edgar.shtml) and SEDAR (www.sedar.com) and will be available at www.villagefarms.com.
Conference Call
Village Farms’ management team will host a conference call today, Tuesday, March 1, 2022 at 8:30 a.m. ET, to discuss its financial results. Participants can access the conference call by telephone by dialing (416) 764-8659 or (888) 664-6392, or via the Internet at: https://bit.ly/3rku2Cl.
For those unable to participate in the conference call at the scheduled time, it will be archived for replay both by telephone and via the Internet beginning approximately one hour following completion of the call. To access the archived conference call by telephone, dial (416) 764-8677 or (888) 390-0541 and enter the passcode 003174 followed by the pound (#) key. The telephone replay will be available until Tuesday, March 8, 2022 at midnight (ET). The conference call will also be available on Village Farms’ web site at http://villagefarms.com/investor-relations/investor-calls.
About Village Farms International, Inc.
Village Farms leverages decades of experience as a large-scale, Controlled Environment Agriculture-based, vertically integrated supplier for high-value, high-growth plant-based Consumer Packaged Goods opportunities, with a strong foundation as a leading fresh produce supplier to grocery and large-format retailers throughout the US and Canada, and new high-growth opportunities in the cannabis and CBD categories in North America and selected markets internationally.
In Canada, the Company’s wholly-owned Canadian subsidiary, Pure Sunfarms, is one of the single largest cannabis operations in the world, the lowest-cost greenhouse producer and one of Canada’s best-selling brands. The Company also owns 70% of Québec-based, Rose LifeScience, a leading third-party cannabis products commercialization expert in the Province of Québec,
In the US, wholly-owned Balanced Health Botanicals is one of the leading CBD brands and e-commerce platforms in the country. Subject to compliance with all applicable US federal and state laws and stock exchange rules, Village Farms plans to enter the US high-THC cannabis market via multiple strategies, leveraging one of the largest greenhouse operations in the country (more than 5.5 million square feet in West Texas), as well as the operational and product expertise gained through Pure Sunfarms’ cannabis success in Canada.
Internationally, Village Farms is targeting selected, nascent, legal cannabis and CBD opportunities with significant medium- and long-term potential, with an initial focus on the Asia-Pacific region and Europe.
 Original Press Release