 WM Technology, Inc. Reports Second Quarter 2021 Financial Results and Affirms 2021 Outlook
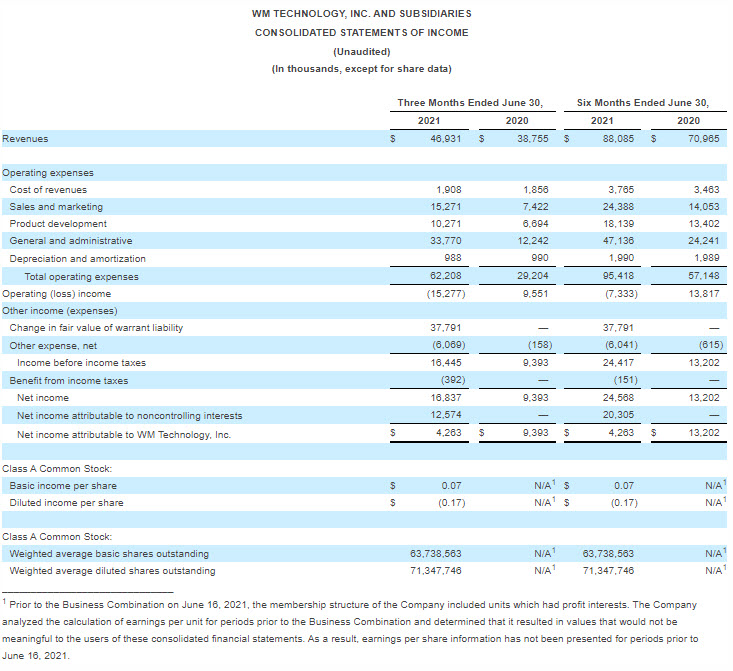
- Second Quarter Revenue increased to $47 million
- Total Revenue grew 21% year-over-year with U.S. Revenue growth of 55% year-over-year
- Company reaffirms prior full year 2021 Revenue and Adjusted EBITDA Guidance of $205 million and $50 million, respectively
IRVINE, Calif., August 12, 2021–(BUSINESS WIRE)–WM Technology, Inc. (“WM Technology” or the “Company”) (Nasdaq: MAPS), a leading technology and software infrastructure provider to the cannabis industry, today announced its financial results for the second quarter ended June 30, 2021.
Our second quarter results and momentum are evidence of the opportunities we have across our end-markets. We saw strong growth in both users accessing the Weedmaps marketplace, and clients leveraging our WM Business software offering within our U.S. end-markets. The growth in client monetization we are driving versus a year ago is evidence of WM Technology’s value proposition to our clients as they seek to grow their businesses compliantly and access hard-to-reach users.
 Chris Beals, CEO and Chairman of WM Technology
We have also seen positive developments with the pace of license issuance within our existing end-markets and the pace of new states passing regulations for adult-use. While we are proud of these results, we remain focused on executing against our plans to establish the Weedmaps marketplace as the center of commerce for cannabis consumers and WM Business as the software solution of choice for cannabis businesses.
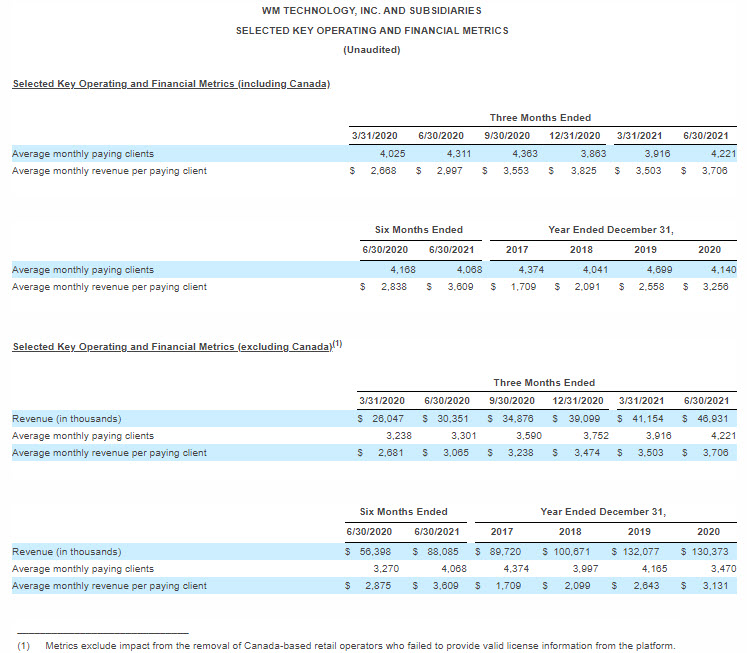
Arden Lee, WM Technology’s CFO, added, “Our $47 million in second quarter revenue represents a 55% increase over the second quarter of last year, when adjusting the second quarter of last year to exclude revenue associated with Canada-based retail operators who failed to provide valid license information and were removed from the Weedmaps marketplace during the second half of 2020. Our results reflect double-digit year-over-year increases in both Average Monthly Revenue per Paying Client and Average Monthly Paying Clients using WM Business within our U.S. end-markets. We are investing heavily on multiple product-driven growth opportunities and new market openings for 2022 and beyond, while capitalizing on solid operating momentum across our existing end-markets. We continue to expect total revenue and adjusted EBITDA of $205 million and $50 million for 2021, consistent with our prior guidance.”
Second Quarter 2021 Highlights
- Revenue increased to $46.9 million, up 21% from the second quarter of 2020 or 55% when adjusting the prior second quarter to exclude revenue associated with Canada-based retail operators who failed to provide valid license information and were subsequently removed from Weedmaps marketplace.
- Monthly active users (“MAUs”)(1)(2) increased to 12.3 million at June 30, 2021 or 75% compared to the prior year period (or 56% when adjusting the current period to exclude the MAUs attributed to the Learn section of weedmaps.com that we were not able to track during the prior period).
- Average monthly revenue per paying client(1)(3) increased to $3,706 or 24% compared to the prior year period (or 21% when excluding revenue from Canada-based retail operators who failed to provide valid license information from the prior year period).
- Average monthly paying clients(1)(4) decreased to 4,221 or (2)% compared to the prior year period (or increased 28% when excluding Canada-based retail operators who failed to provide valid license information from the prior year period).
- Net income was $16.8 million as compared to $9.4 million from the prior year period.
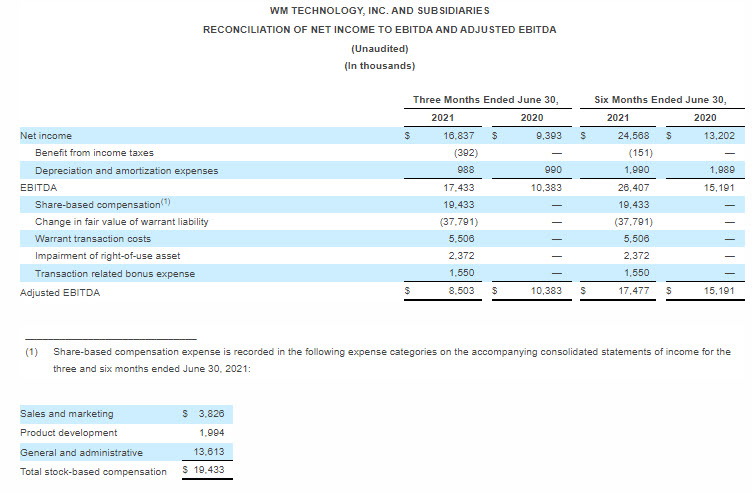
- Adjusted EBITDA(5) was $8.5 million as compared to $10.4 million from the prior year period.
- Basic net income per share(6) was $0.07 based on 63.7 million of Class A Common Stock weighted average shares outstanding. Diluted net loss per share(7) was $(0.17) based on 71.3 million Class A Common Stock weighted average diluted shares outstanding. The weighted average share count used in the basic GAAP net income per share calculation excludes:
- 65.5 million shares of Class A Common Stock issuable upon exchange of Class A units representing limited liability company interests of WM Holding Company, LLC (“WMH”) combined with an equivalent number of shares of Class V Common Stock.
- 7.0 million shares of Class A Common Stock issuable upon exercise of warrants originally issued in a private placement in connection with the initial public offering of Silver Spike Acquisition Corp. (“Silver Spike”).
- 12.5 million shares of Class A Common Stock issuable upon exercise of the public warrants originally issued in the initial public offering of Silver Spike.
- Up to 25.7 million shares of Class A Common Stock issuable upon exchange of Class P units representing limited liability company interests of WMH (“Class P Units”).
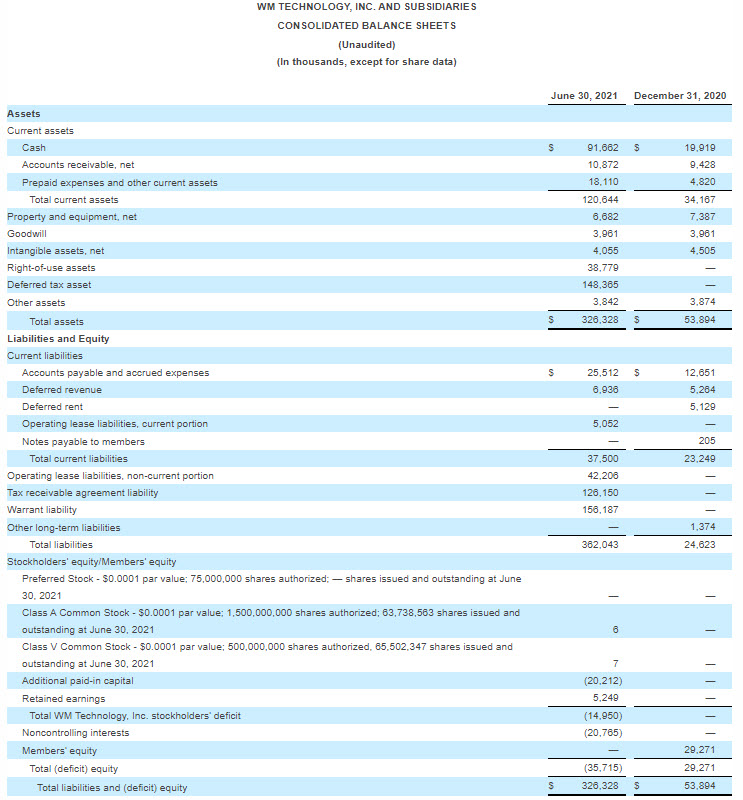
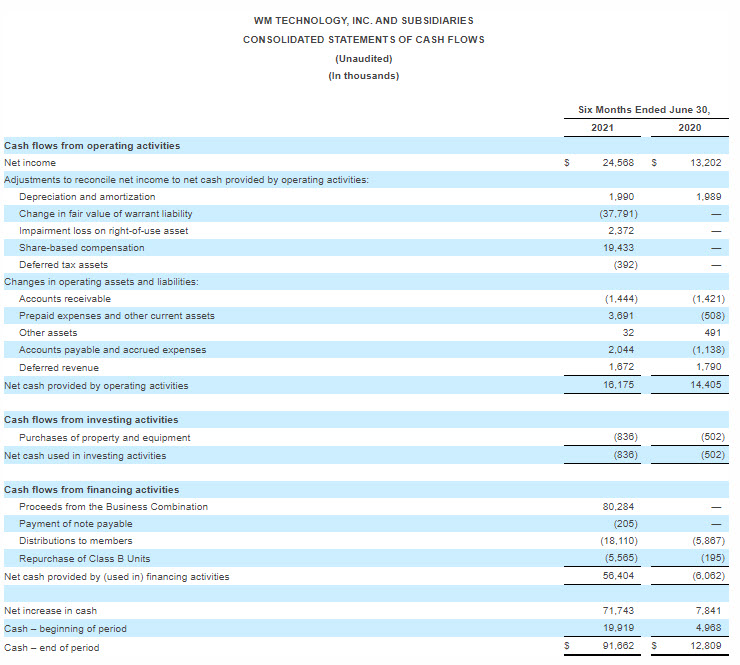
- Cash totaled $91.7 million as of June 30, 2021.
Reconciliations of GAAP to non-GAAP financial measures have been provided in the tables included in this release.
______________________________
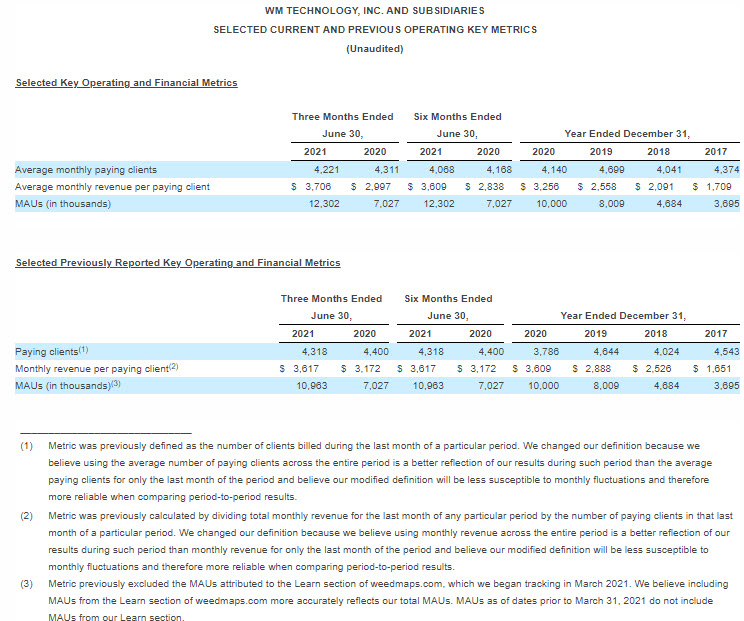
(1) We have modified the definition and calculation of three of our Key Operating and Financial Metrics: (a) average monthly revenue per paying client, (b) average monthly paying clients, and (c) MAUs. We made these modifications in order to better reflect our performance during a reporting period and to make these key metrics more easily comparable on a period-to-period basis. For comparison of these metrics to previous calculations see “Selected Current and Previous Operating Key Metrics” below.
(2) MAUs are defined as the number of unique users opening our Weedmaps mobile app or accessing our Weedmaps.com website over the course of a calendar month. This metric previously excluded the MAUs attributed to the Learn section of weedmaps.com, which we began tracking in March 2021. See “Selected Current and Previous Operating Metrics” below for a description of how we used to calculate MAUs and what our MAUs would have been using our prior definition for the applicable periods.
(3) Average monthly revenue per paying client is defined as the average monthly revenue for any particular period divided by the average monthly paying clients in the same respective period. See “Selected Current and Previous Operating Metrics” below for a description of how we used to calculate average monthly revenue per paying client and what our average monthly revenue per paying client would have been using our prior definition for the applicable periods.
(4) Average monthly paying clients are defined as the average of the number of paying clients billed in a month across a particular period (and for which services were provided). See “Selected Current and Previous Operating Metrics” below for a description of how we used to calculate average monthly paying clients and what our average monthly paying clients would have been using our prior definition for the applicable periods.
(5) For further information about how we calculate EBITDA and Adjusted EBITDA as well as limitations of their use and a reconciliation of EBITDA and Adjusted EBITDA to net income, see “Reconciliation of Net Income to EBITDA and Adjusted EBITDA” below.
(6) Basic Net Income per share is only for Net Income attributable to controlling interests after the business combination (the “Business Combination”) on June 16, 2021 pursuant to that certain Agreement and Plan of Merger, dated December 10, 2020, by and among Silver Spike, Silver Spike Merger Sub LLC, WMH and Ghost Media Group, LLC.
(7) Diluted Net Income per share is only for Net Income attributable to controlling interests after the Business Combination on June 16, 2021. Diluted Net Income also deducts the fair value change of public and private placement warrants, net of amounts attributable to noncontrolling interests.
Investor Conference Call and Webcasts
The Company will host a conference call and webcast today, Thursday, August 12, 2021, at 2:00 p.m. Pacific Time (5:00 p.m. Eastern Time) by dialing (833) 855-0799 (United States and Canada) or (409) 937-8921 (International) and providing Conference ID 6739983. A live webcast of the call will also be available on the WM Technology investor relations website at ir.weedmaps.com.
A telephone replay of the call may be accessed the same day from Thursday, August 12, 2021 until 5:00 Pacific Time (8:00 p.m. Eastern Time) on Thursday, August 19, 2021 by dialing (855) 859-2056 (United States and Canada) or (404) 537-3406 (International) and providing Conference ID 6739983. A webcast replay will also be archived at ir.weedmaps.com.
About WM Technology
The Company’s mission is to power a transparent and inclusive global cannabis economy. Now in its second decade, WM Technology has been a driving force behind much of the legislative change we’ve seen in the past 10 years.
Founded in 2008, WM Technology, is a leading technology and software infrastructure provider to the cannabis industry, comprising a B2C platform, Weedmaps, and B2B software, WM Business. The cloud-based SaaS solutions from WM Business provide an end-to-end operating system for cannabis retailers. WM Business’ tools support compliance with the complex, disparate, and constantly evolving regulations applicable to the cannabis industry. Through its website and mobile apps, WM Technology provides consumers with the latest information about cannabis retailers, brands, and products, facilitating product discovery and driving engagement with our retail and brand customers.
WM Technology holds a strong belief in the power of cannabis and the importance of enabling safe, legal access to consumers worldwide. Since inception, WM Technology has worked tirelessly, not only to become the most comprehensive platform for consumers, but to build the software solutions that power businesses compliantly in the space, to advocate for legalization, social equity, and licensing in many jurisdictions, and to facilitate further learning through partnering with subject matter experts on providing detailed, accurate information about the plant.
Headquartered in Irvine, California, WM Technology supports remote work for all eligible employees. Visit us at www.weedmaps.com.
Use of Non-GAAP Financial Measures
To provide investors with additional information regarding our financial results, we have disclosed EBITDA and Adjusted EBITDA, both of which are non-GAAP financial measures that we calculate as net income before taxes and depreciation and amortization in the case of EBITDA and further adjusted to exclude non-cash, unusual and/or infrequent costs in the case of Adjusted EBITDA. Below we have provided a reconciliation of net income (the most directly comparable GAAP financial measure) to EBITDA and from EBITDA to Adjusted EBITDA.
We present EBITDA and Adjusted EBITDA because these metrics are a key measure used by our management to evaluate our operating performance, generate future operating plans and make strategic decisions regarding the allocation of investment capacity. Accordingly, we believe that EBITDA and Adjusted EBITDA provide useful information to investors and others in understanding and evaluating our operating results in the same manner as our management.
EBITDA and Adjusted EBITDA have limitations as an analytical tool, and you should not consider it in isolation or as a substitute for analysis of our results as reported under GAAP. Some of these limitations are as follows:
- although depreciation and amortization are non-cash charges, the assets being depreciated and amortized may have to be replaced in the future, and both EBITDA and Adjusted EBITDA do not reflect cash capital expenditure requirements for such replacements or for new capital expenditure requirements;
- EBITDA and Adjusted EBITDA do not reflect changes in, or cash requirements for, our working capital needs; and
- EBITDA and Adjusted EBITDA do not reflect tax payments that may represent a reduction in cash available to us.
Because of these limitations, you should consider EBITDA and Adjusted EBITDA alongside other financial performance measures, including net income and our other GAAP results.
Definition of Key Operating and Financial Metrics
- Average Monthly Revenue Per Paying Client: Average monthly revenue per paying client measures how much clients, for the period of measurement, are willing to pay us for our subscription and additional offerings and the efficiency of the bid-auction process for our featured listings placements. We calculate this metric by dividing the average monthly revenue for any particular period by the average monthly number of paying clients in the same respective period. The calculation of monthly revenue includes revenue from any clients that cease to be paying clients during the applicable month.
- Average Monthly Paying Clients: We define average monthly paying clients as the monthly average of clients billed each month over a particular period (and for which services were provided).
- MAUs: We define MAUs as the number of unique users opening our Weedmaps mobile app or accessing our Weedmaps.com website over the course of a calendar month. In any particular period, we determine our number of MAUs by counting the total number of users who have engaged with the weedmaps.com site during the final calendar month of the given period.