![]()
WM Technology, Inc. Reports Fourth Quarter and Full Year 2021 Financial Results
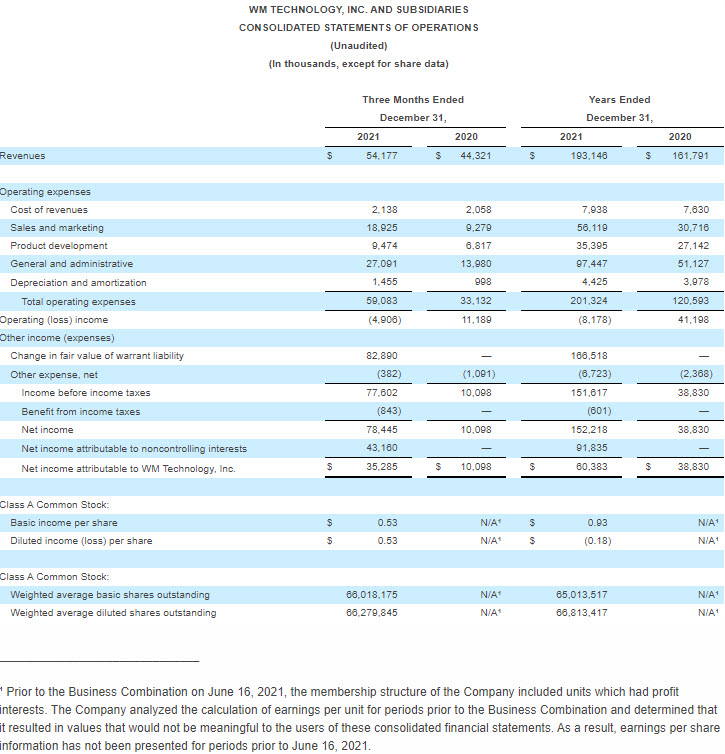
- Fourth Quarter Revenue increased to $54.2 million, exceeding expectations, with Full Year Revenue of $193.1 million
- U.S. Fourth Quarter Revenue grew 39% with Total Fourth Quarter Revenue growth of 22% year-over-year
- U.S. Full Year Revenue grew 48% with Total Full Year Revenue growth of 19% year-over-year
IRVINE, Calif., February 23, 2022–(BUSINESS WIRE)–WM Technology, Inc. (“WM Technology” or the “Company”) (Nasdaq: MAPS), a leading marketplace and technology solutions provider to the cannabis industry, today announced its financial results for the fourth quarter ending December 31, 2021.
Our fourth quarter performance was the largest quarterly revenue in our Company’s history at $54 million, which represents a 39% year-over-year growth in our U.S. business. Further, we added over 300 new paying clients during the fourth quarter and expanded our share of licensees in the U.S.
 Chris Beals, CEO and Chairman of WM Technology
We believe our growth in the current environment underscores the value we continue to deliver to our clients and is evidence of how they fundamentally understand the importance of Weedmaps to grow their businesses. I’m excited by the opportunities ahead of us in 2022.
Beals added, “We will continue to drive deep client engagement, establish Weedmaps as the center of commerce for cannabis consumers and expand adoption of WM Business as we look to attack new markets. Finally, I’d like to thank all of the team members at WM Technology for their collective contribution to our growth.”
Fourth Quarter 2021 Financial Highlights
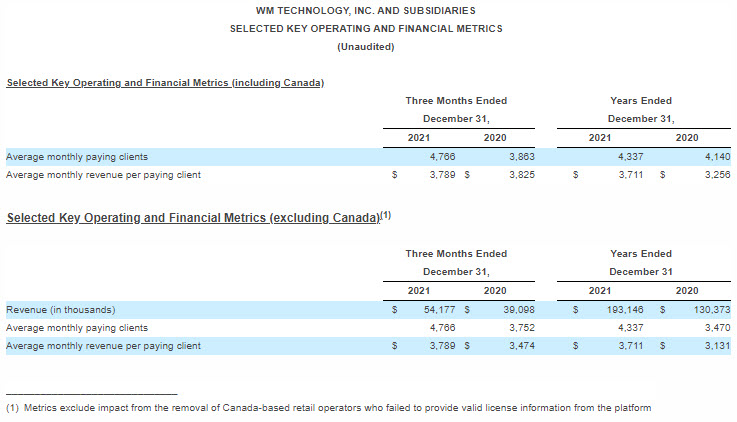
- Total revenue increased to $54.2 million, up 22% from the fourth quarter of 2020 or 39% in the U.S. (when adjusting the prior fourth quarter to exclude revenue associated with Canada-based retail operators who failed to provide valid license information and were subsequently removed from the Weedmaps marketplace).
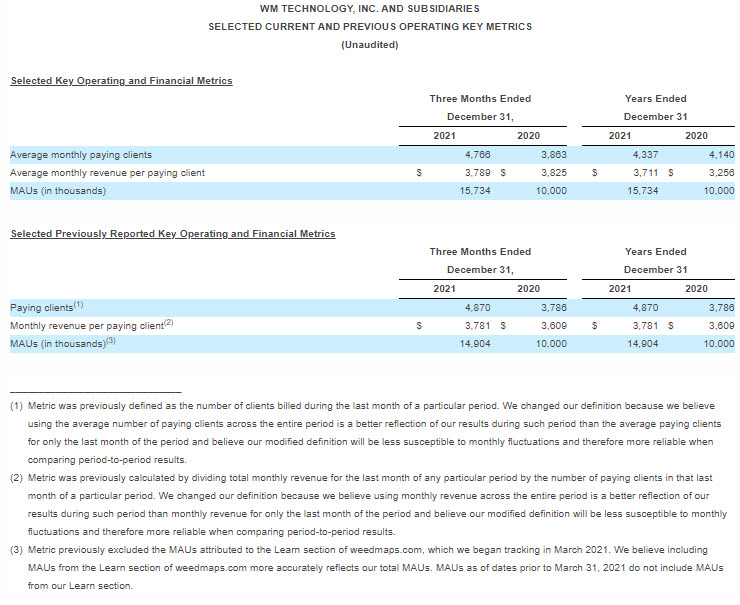
- Monthly active users (“MAUs”)(1)(2) increased to 15.7 million as of December 31, 2021 or 57% compared to the prior year period (or 49% when adjusting the current period to exclude the MAUs attributed to the Learn section of weedmaps.com that we were not able to track during the prior period).
- Average monthly revenue per paying client(1)(3) slightly decreased to $3,789 or less than 1% compared to the prior year period (or increased 9% when excluding revenue from Canada-based retail operators who failed to provide valid license information from the prior year period).
- Average monthly paying clients(1)(4) increased by 23% to 4,766 compared to the prior year period (or increased 27% when excluding Canada-based retail operators who failed to provide valid license information from the prior year period).
- Gross Profit was $52.0 million implying a 96% margin rate, which reflects a 70bps margin expansion from the prior year period.
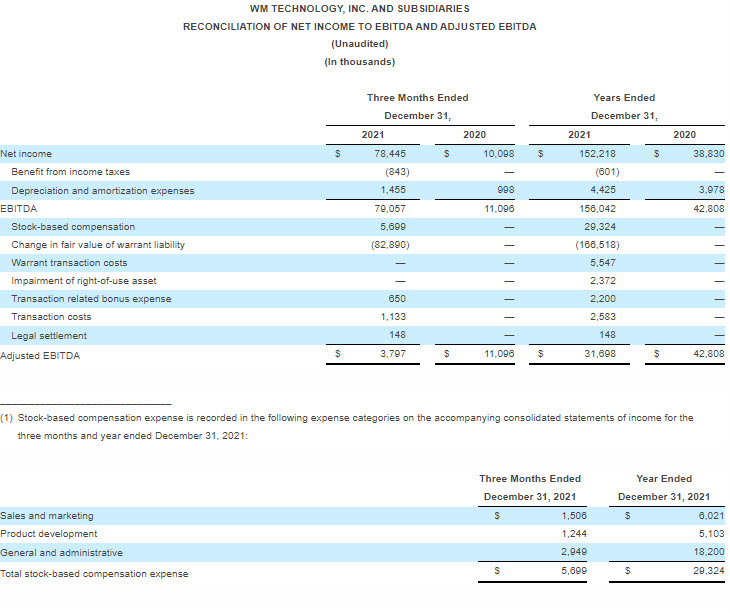
- Net income was $78.4 million as compared to $10.1 million from the prior year period.
- Adjusted EBITDA(5) was $3.8 million as compared to $11.1 million from the prior year period.
- Basic and diluted net income per share was $0.53 based on 66.0 million and 66.3 million of Class A Common Stock weighted average shares outstanding, respectively.
- As of December 31, 2021, our share count includes:
- 65.7 million shares of Class A Common Stock.
- 65.5 million shares of Class A Common Stock issuable upon exchange of Class A units representing limited liability company interests of WM Holding Company, LLC (“WMH”) combined with an equivalent number of shares of Class V Common Stock.
- 7.0 million shares of Class A Common Stock issuable upon exercise of warrants originally issued in a private placement in connection with the initial public offering of Silver Spike Acquisition Corp. (“Silver Spike”).
- 12.5 million shares of Class A Common Stock issuable upon exercise of the public warrants originally issued in the initial public offering of Silver Spike.
- Up to 25.7 million shares of Class A Common Stock, 23.7 million of which have vested, issuable upon exchange of Class P units representing limited liability company interests of WMH (“Class P Units”).
- 6.6 million granted restricted stock units, of which 0.6 million had vested as of December 31, 2021.
- 2.4 million granted and unvested performance-based restricted stock units.
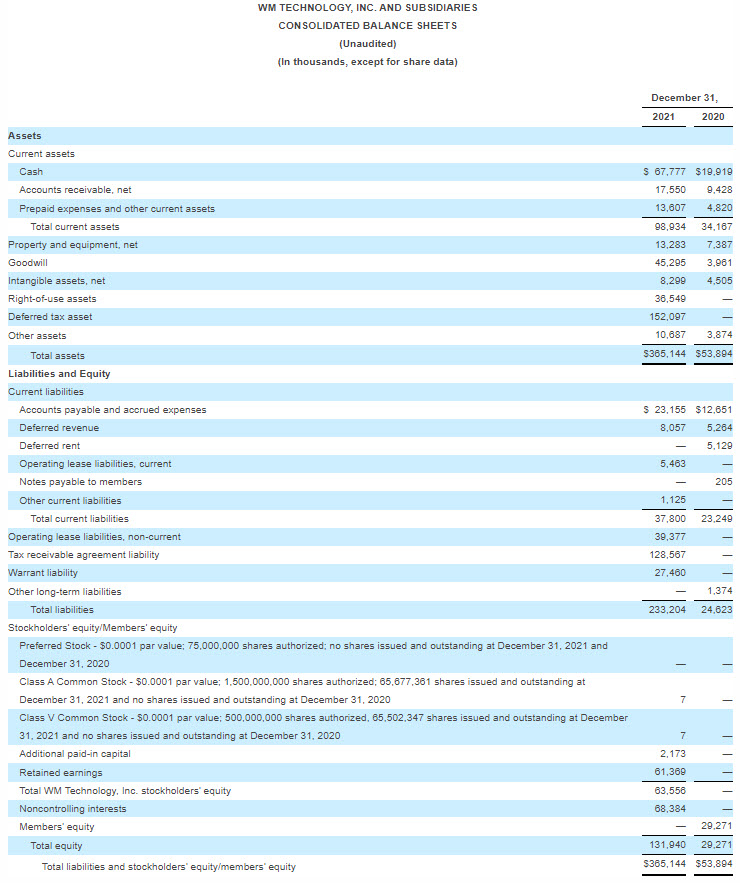
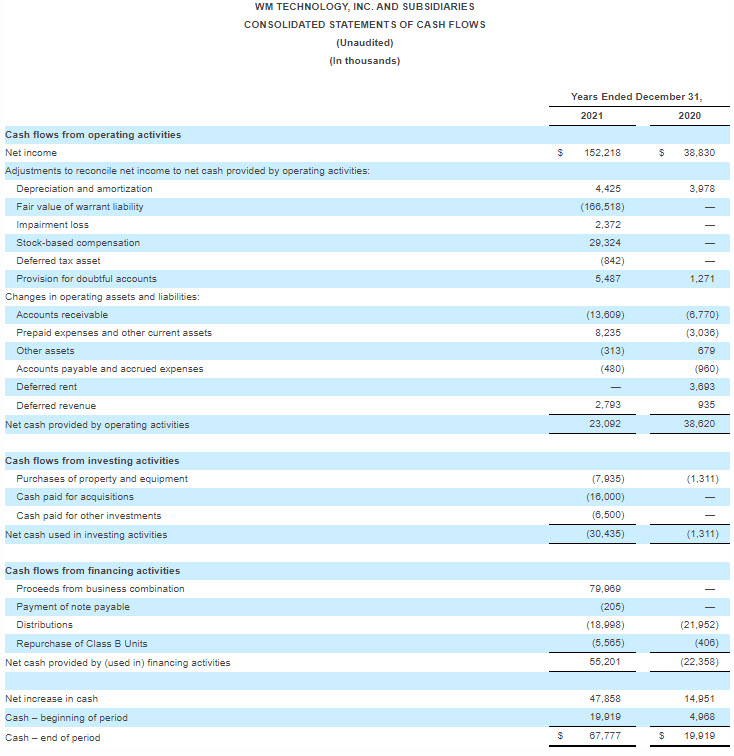
- Cash totaled $67.8 million as of December 31, 2021.
Fiscal Year 2021 Financial Highlights
- Total revenue increased to $193.1 million, up 19% from the prior year or 48% in the U.S. (when adjusting the prior year to exclude revenue associated with Canada-based retail operators who failed to provide valid license information and were subsequently removed from the Weedmaps marketplace).
- Average monthly revenue per paying client(1)(3) increased to $3,711, or 14%, compared to the prior year (or increased 19% when excluding revenue from Canada-based retail operators who failed to provide valid license information from the prior year).
- Average monthly paying clients(1)(4) increased by 5% to 4,337 compared to the prior year (or increased 25% when excluding Canada-based retail operators who failed to provide valid license information from the prior year).
- Gross Profit was $185.2 million, implying a 96% margin rate, which reflects a 61bps margin expansion from the prior year.
- Net income was $152.2 million as compared to $38.8 million from the prior year.
- Adjusted EBITDA(5) was $31.7 million as compared to $42.8 million for the prior year.
- Basic and diluted net income (loss) per share was $0.93 and $(0.18), respectively, based on 65.0 million and 66.8 million of basic and diluted Class A Common Stock weighted average shares outstanding, respectively.
Reconciliations of GAAP to non-GAAP financial measures have been provided in the tables included in this release.
______________________________
- We have modified the definition and calculation of three of our Key Operating and Financial Metrics: (a) average monthly revenue per paying client, (b) average monthly paying clients, and (c) MAUs. We made these modifications in order to better reflect our performance during a reporting period and to make these key metrics more easily comparable on a period-to-period basis. For comparison of these metrics to previous calculations see “Selected Current and Previous Operating Key Metrics” below.
- MAUs are defined as the number of unique users opening our Weedmaps mobile app or accessing our Weedmaps.com website over the course of a calendar month. This metric previously excluded the MAUs attributed to the Learn section of weedmaps.com, which we began tracking in March 2021. See “Selected Current and Previous Operating Metrics” below for a description of how we used to calculate MAUs and what our MAUs would have been using our prior definition for the applicable periods.
- Average monthly revenue per paying client is defined as the average monthly revenue for any particular period divided by the average monthly paying clients in the same respective period. See “Selected Current and Previous Operating Metrics” below for a description of how we used to calculate average monthly revenue per paying client and what our average monthly revenue per paying client would have been using our prior definition for the applicable periods.
- Average monthly paying clients are defined as the average of the number of paying clients billed in a month across a particular period (and for which services were provided). See “Selected Current and Previous Operating Metrics” below for a description of how we used to calculate average monthly paying clients and what our average monthly paying clients would have been using our prior definition for the applicable periods.
- For further information about how we calculate EBITDA and Adjusted EBITDA as well as limitations of their use and a reconciliation of EBITDA and Adjusted EBITDA to net income, see “Reconciliation of Net Income to EBITDA and Adjusted EBITDA” below.
2022 Business Outlook
Based on current business trends and conditions, the outlook for the fiscal year ending December 31, 2022, is expected to be as follows:
- Full year Revenue is estimated to be between $255 million and $265 million, which represents 32-37% growth, with first quarter Revenue between $54 million and $56 million, which represents 31-36% growth
- Full year Adjusted EBITDA is estimated to be between $15 million and $20 million and includes the impact of approximately $30 million in planned investments related to initiatives for growth in fiscal year 2023 and beyond. Adjusted EBITDA margins for the first quarter are expected to be breakeven
The guidance provided above is only an estimate of what we believe is realizable as of the date of this release. We are not readily able to provide a reconciliation of projected Adjusted EBITDA to projected net income without unreasonable effort. This guidance assumes that no business acquisitions, investments, restructurings, or legal settlements are concluded in the quarterly and annual periods. Our results are based on assumptions that we believe to be reasonable as of this date, but may be materially affected by many factors, as discussed below in “Forward-Looking Statements.” Actual results may vary from the guidance and the variations may be material. We undertake no intent or obligation to publicly update or revise any of these projections, whether as a result of new information, future events or otherwise, except as required by law.
Investor Conference Call and Webcasts
The Company will host a conference call and webcast today, Wednesday, February 23, 2022, at 2:00 p.m. Pacific Time (5:00 p.m. Eastern Time) by dialing (833) 855-0799 (United States and Canada) or (409) 937-8921 (International) and providing Conference ID 4698716. A live webcast of the call will also be available on the WM Technology investor relations website at ir.weedmaps.com.
A telephone replay of the call may be accessed the same day from Wednesday, February 23, 2022 until 5:00 Pacific Time (8:00 p.m. Eastern Time) on Wednesday, March 2, 2022 by dialing (855) 859-2056 (United States and Canada) or (404) 537-3406 (International) and providing Conference ID 4698716. A webcast replay will also be archived at ir.weedmaps.com.
About WM Technology
Founded in 2008, WM Technology operates a leading online marketplace with a comprehensive set of eCommerce and compliance software solutions sold to retailers and brands in the U.S. state-legal and Canadian cannabis markets. The Company’s mission is to power a transparent and inclusive global cannabis economy. We address the challenges facing both consumers seeking to understand cannabis products and businesses who serve cannabis users in a legally compliant fashion with our Weedmaps marketplace and WM Business software solutions. Over the past 13 years, we have grown the Weedmaps marketplace to become a premier destination for cannabis consumers to discover and browse information regarding cannabis and cannabis products, permitting product discovery and order-ahead for pickup or delivery by participating retailers. WM Business is a set of eCommerce-enablement tools designed to help our retailer and brand clients get the best out of their Weedmaps experience, while creating labor efficiency and managing their compliance needs.
WM Technology holds a strong belief in the power of cannabis and the importance of enabling safe, legal access to consumers worldwide. Since inception, WM Technology has worked tirelessly, not only to become the most comprehensive platform for consumers, but to build the software solutions that power businesses compliantly in the space, to advocate for legalization, social equity, and licensing in many jurisdictions, and to facilitate further learning through partnering with subject matter experts on providing detailed, accurate information about the plant.
Headquartered in Irvine, California, WM Technology supports remote work for all eligible employees. Visit us at www.weedmaps.com.
Use of Non-GAAP Financial Measures
To provide investors with additional information regarding our financial results, we have disclosed EBITDA and Adjusted EBITDA, both of which are non-GAAP financial measures that we calculate as net income before interest, taxes and depreciation and amortization in the case of EBITDA and further adjusted to exclude non-cash, unusual and/or infrequent costs in the case of Adjusted EBITDA. Below we have provided a reconciliation of net income (the most directly comparable GAAP financial measure) to EBITDA and from EBITDA to Adjusted EBITDA.
We present EBITDA and Adjusted EBITDA because these metrics are a key measure used by our management to evaluate our operating performance, generate future operating plans and make strategic decisions regarding the allocation of investment capacity. Accordingly, we believe that EBITDA and Adjusted EBITDA provide useful information to investors and others in understanding and evaluating our operating results in the same manner as our management.
EBITDA and Adjusted EBITDA have limitations as an analytical tool, and you should not consider it in isolation or as a substitute for analysis of our results as reported under GAAP. Some of these limitations are as follows:
- although depreciation and amortization are non-cash charges, the assets being depreciated and amortized may have to be replaced in the future, and both EBITDA and Adjusted EBITDA do not reflect cash capital expenditure requirements for such replacements or for new capital expenditure requirements;
- EBITDA and Adjusted EBITDA do not reflect changes in, or cash requirements for, our working capital needs; and
- EBITDA and Adjusted EBITDA do not reflect tax payments that may represent a reduction in cash available to us.
Because of these limitations, you should consider EBITDA and Adjusted EBITDA alongside other financial performance measures, including net income and our other GAAP results.
Definition of Key Operating and Financial Metrics
- Average Monthly Revenue Per Paying Client: Average monthly revenue per paying client measures how much clients, for the period of measurement, are willing to pay us for our subscription and additional offerings and the efficiency of the bid-auction process for our featured listings placements. We calculate this metric by dividing the average monthly revenue for any particular period by the average monthly number of paying clients in the same respective period. The calculation of monthly revenue includes revenue from any clients that cease to be paying clients during the applicable month.
- Average Monthly Paying Clients: We define average monthly paying clients as the monthly average of clients billed each month over a particular period (and for which services were provided).
- MAUs: We define MAUs as the number of unique users opening our Weedmaps mobile app or accessing our Weedmaps.com website over the course of a calendar month. In any particular period, we determine our number of MAUs by counting the total number of users who have engaged with the weedmaps.com site during the final calendar month of the given period.