![]()
Cronos Group Reports 2020 Fourth Quarter and Full-Year Results
- Announces plans to launch Happy Dance™ in ULTA Beauty™
- Cronos Israel continues to grow the PEACE NATURALS™ brand in the Israeli medical cannabis market
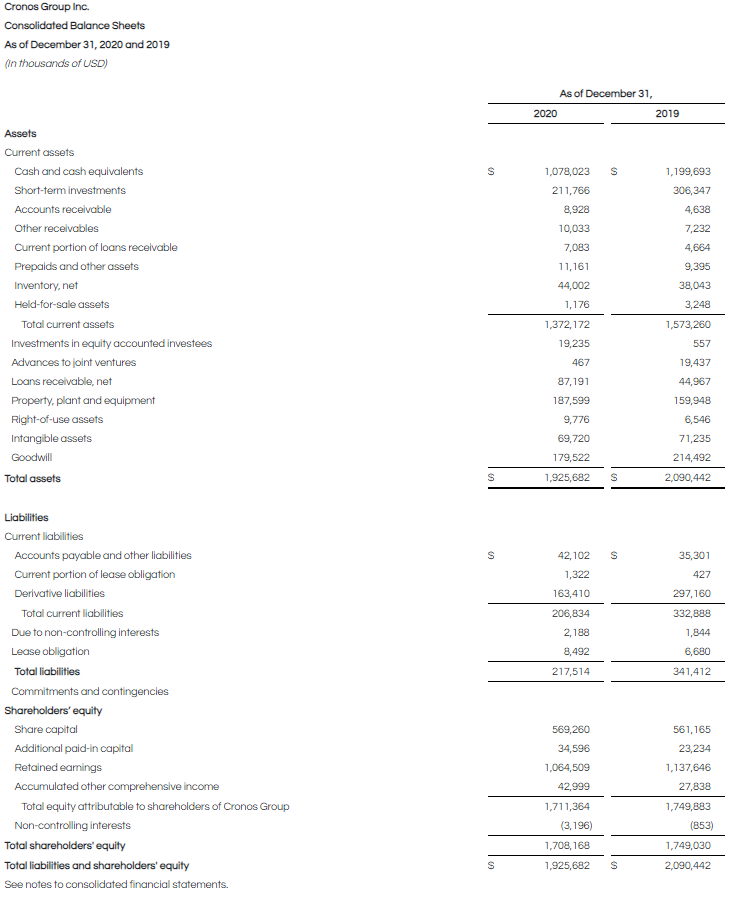
- Preserves robust balance sheet with approximately USD$1.3 billion in cash and short-term investments
TORONTO, Feb. 26, 2021 (GLOBE NEWSWIRE) — Cronos Group Inc. (NASDAQ: CRON) (TSX: CRON) (“Cronos Group” or the “Company”), today announces its 2020 fourth quarter and full-year business results.
“Our fourth quarter 2020 results are the summation of the hard work and perseverance the Company has put into this past year despite the challenges of 2020. As we look to 2021, I’m incredibly excited about the teams we have supporting our brands and the breakthrough research and development (“R&D”), innovation and exciting marketing campaigns Cronos Group plans to execute on,” said Kurt Schmidt, President and CEO of Cronos Group.
We are poised to build upon the growth we experienced in 2020 as we continue to push cannabinoid innovation and differentiated product offerings under our portfolio of brands.
 Kurt Schmidt, President and CEO of Cronos Group
My goals this year will be to focus on building a winning team by fostering a collaborative, performance-driven culture; continue to focus on creating disruptive technology and innovation; grow and develop our brands and strengthen our ability to compete through R&D, strategic global infrastructure and engaging in the legislative process in key markets.
Financial Results
Fourth Quarter 2020
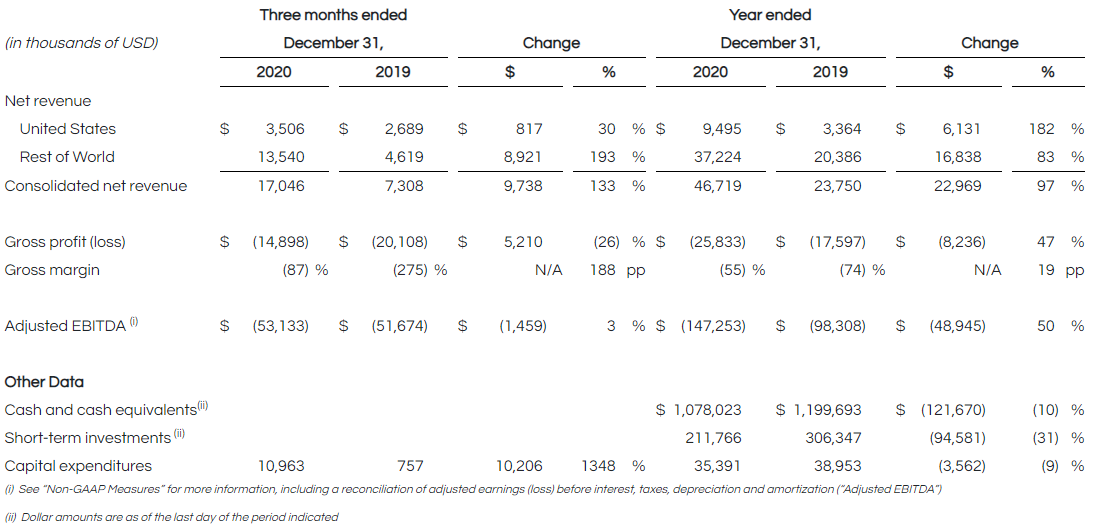
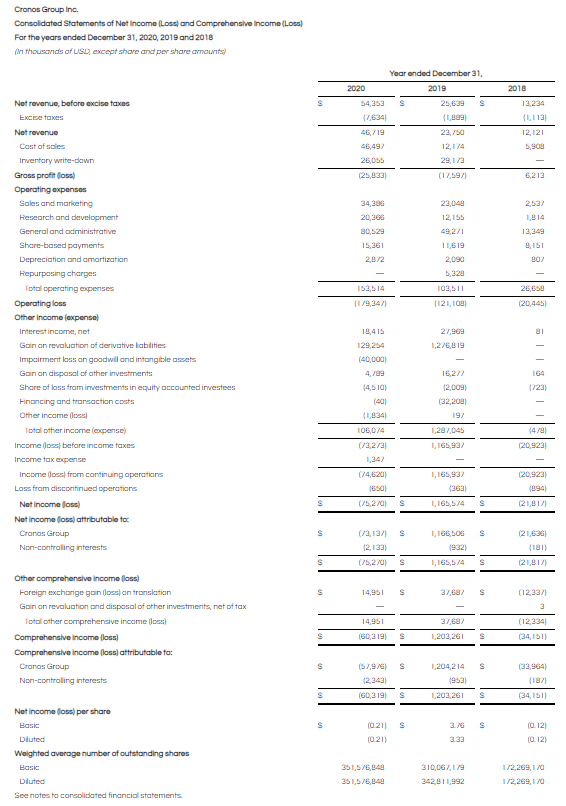
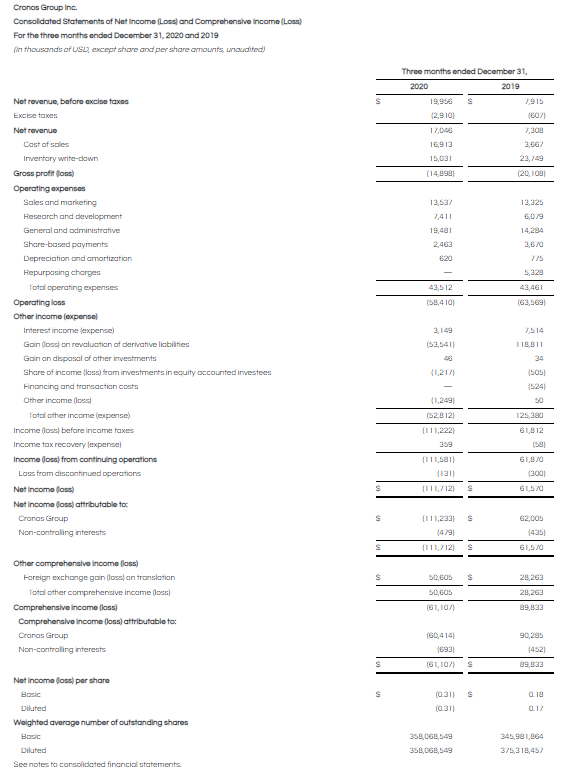
- Net revenue of $17.0 million in Q4 2020 increased by $9.7 million from Q4 2019. The increase year-over-year was primarily driven by continued growth in the adult-use market in Canada, sales in the Israeli medical market and growth in our U.S. segment. Partially offset by non-recurring wholesale revenue in the Canadian market in Q4 2019 and strategic price reductions on various adult-use cannabis products in Canada in Q4 2020.
- Gross loss of $14.9 million in Q4 2020 decreased by $5.2 million from Q4 2019. The decrease in losses year-over-year was primarily driven by a decline in inventory write-downs and increased gross profit in the U.S. segment. Offset by third party purchased flower associated with adult-use products in Canada and a decline in wholesale sales in Q4 2020 versus Q4 2019.
- The Company incurred an inventory write-down in Q4 2020 of $15.0 million on dried cannabis and cannabis extracts, primarily driven by cannabis product price compression in the Canadian market. The Company may incur further inventory write-downs due to pricing pressures in the marketplace.
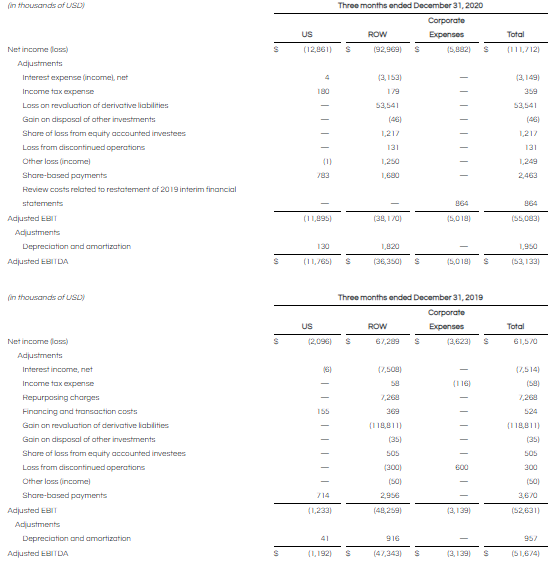
- Adjusted EBITDA loss of $53.1 million in Q4 2020 increased by $1.5 million from Q4 2019. The increase in losses year-over-year was primarily driven by an increase in general and administrative expenses and an increase in R&D spending.
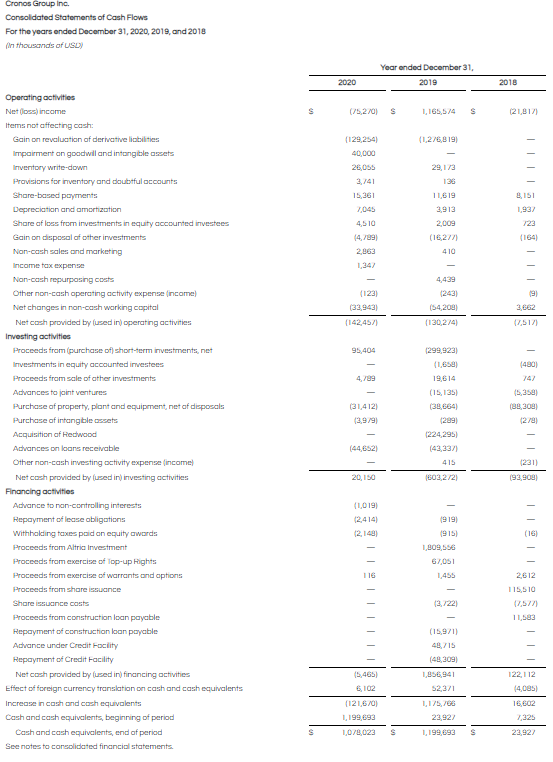
- Capital expenditures of $11.0 million in Q4 2020 increased by $10.2 million from Q4 2019. The increase year-over-year was primarily driven by spending at the Company’s Peace Naturals campus, Cronos Fermentation, our Israeli facility, and our new ERP system.
Full-Year 2020
- Net revenue of $46.7 million in Full-Year 2020 increased by $23.0 million from Full-Year 2019. The increase year-over-year was primarily driven by continued growth in the adult-use market in Canada, growth in our U.S. segment, which included a full-year of the Redwood business as opposed to 117 days in Full-Year 2019, and sales in the Israeli medical market. Partially offset by non-recurring wholesale revenue in the Canadian market in Full-Year 2019 and strategic price reductions on various adult-use cannabis products in Canada in Full-Year 2020.
- Gross loss of $25.8 million in Full-Year 2020 increased by $8.2 million from Full-Year 2019. The increase in losses year-over-year was primarily driven by third party purchased flower associated with adult-use products in Canada and a decline in wholesale sales in Full-Year 2020 versus Full-Year 2019. Partially offset by increased gross profit in the U.S. segment due to a full year of results from the Redwood business and a decrease in inventory write-downs in the ROW segment.
- The Company incurred an inventory write-down in Full-Year 2020 of $26.1 million, on dried cannabis and cannabis extracts, primarily driven by cannabis product price compression in the Canadian market. The Company may incur further inventory write-downs due to pricing pressures in the marketplace.
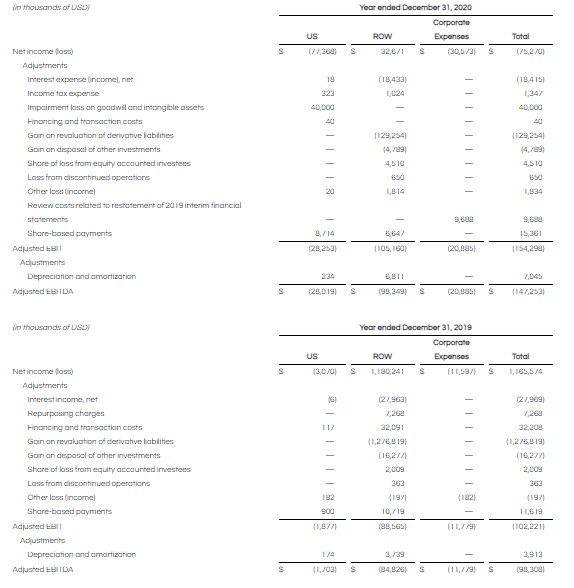
- Adjusted EBITDA loss of $147.3 million in Full-Year 2020 increased by $48.9 million from Full-Year 2019. The increase in losses year-over-year was primarily driven by an increase in gross loss, increased general and administrative expenses, higher sales and marketing costs related to brand development and R&D spending.
- Capital expenditures of $35.4 million in Full-Year 2020 decreased by $3.6 million from Full-Year 2019. The decrease year-over-year was primarily driven by a reduction in spending at the Company’s Peace Naturals campus and Cronos Israel. Partially offset by an increase in spending at Cronos Fermentation.
Business Updates
Brand Portfolio
Happy Dance™ continues its expansion by securing its first major U.S. retailer, ULTA Beauty™. The full collection of Happy Dance™ products is expected to launch online at ULTA.com and in-store in over 550 ULTA Beauty™ locations across the U.S. in the coming weeks. Happy Dance™ was co-founded by actress and New York Times best-selling author Kristen Bell and features an easy-to-use line of clean, vegan and cruelty-free U.S. hemp-derived CBD bath and body products including an All-Over Whipped Body Butter + CBD, Head-to-Toe Coconut Melt + CBD and Stress Away Bath Bomb + CBD.
During 2020, Cronos Israel received all certifications and licenses required for the cultivation, production and marketing of dried flower, pre-rolls and oils in Israel and currently has PEACE NATURALS™ dried flower and oils in market. On January 11, 2021, the PEACE NATURALS™ brand was recognized by the Israeli Marketing Association and was given the 2020 Innovation Award for its successful marketing strategy in 2020, which led to increased brand exposure. The marketing campaign gained this accolade for standing out amongst its peers by focusing on the high-quality nature of PEACE NATURALS™ products. In February 2021, Cronos Israel signed a distribution agreement with the largest pharmacy chain in Israel, Super-Pharm, which has over 250 branches in Israel. Cronos Israel continues to build distribution and brand awareness through a growing network of pharmacies.
Global Supply Chain
In 2020, Cronos Growing Company Inc. (“Cronos GrowCo”), the Company’s joint venture in Canada, fully completed construction of its production facility, including all fixtures within the greenhouse and all post-harvest activity areas. In November 2020, Cronos GrowCo obtained a cultivation license for the operations contemplated by the first phase of the project. The Company expects the facility to become operational in phases beginning in the first half of 2021.
Throughout 2020, Natuera, the Company’s joint venture in Latin America, a fully licensed operation in Colombia for hemp and cannabis derived bulk, consumer, and medicinal cannabinoid products, continued to achieve significant operational milestones. In addition to completing a number of test exports of hemp-derived CBD extract to both the U.S. and the United Kingdom for business development and R&D purposes over the course of 2020, during the fourth quarter of 2020, Natuera completed its first export of hemp-derived CBD extract to the U.S. for commercial purposes.
Update on COVID-19
Cronos Group’s manufacturing sites have adjusted and continue to develop in order to comply with the current COVID-19 guidelines provided by governmental authorities. In the U.S., while online sales have continued despite facing pressure, certain beauty and other retailers have temporarily closed physical boutique locations. State specific limitations on retail capacity have also reduced the ability of larger retailers to offer in-store brand education for the Company’s products. Revenue in the Rest of World segment was not materially impacted by the effects of COVID-19 during the three months or year ended December 31, 2020. However, prolonged closures of retail stores due to government mandated lockdowns as well as the changes in consumer purchasing behavior in Canada during the COVID-19 pandemic are expected to have a negative impact on the Company’s short-term revenue growth in Canada.
Rest of World Results
Cronos Group’s Rest of World reporting segment includes results of the Company’s operations for all markets outside of the U.S.
Fourth Quarter 2020
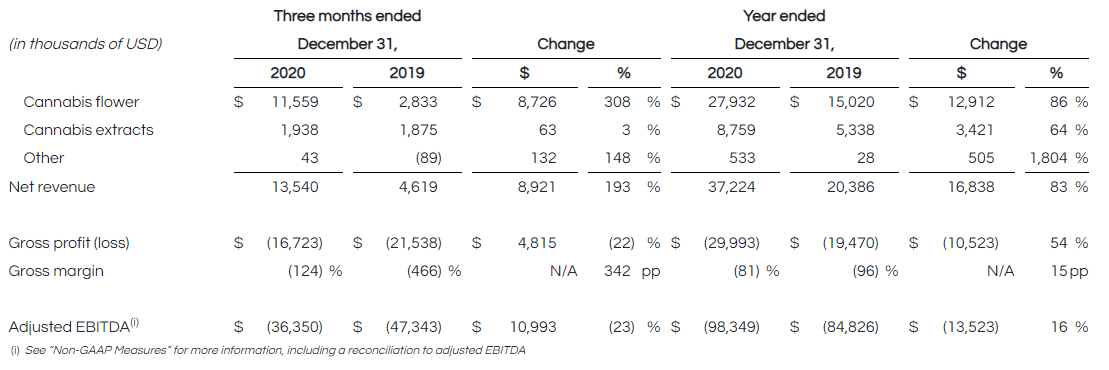
- Net revenue of $13.5 million in Q4 2020 increased by $8.9 million from Q4 2019. The increase year-over-year was primarily driven by continued growth in the adult-use market in Canada and sales in the Israeli medical market. Partially offset by non-recurring wholesale revenue in the Canadian market in Q4 2019 and strategic price reductions on various adult-use cannabis products in Canada in Q4 2020.
- Gross loss of $16.7 million in Q4 2020 decreased by $4.8 million from Q4 2019. The decrease in losses year-over-year was primarily driven by a decline in inventory write-downs. Offset by third party purchased flower associated with adult-use products in Canada and a decline in wholesale sales in Q4 2020 versus Q4 2019.
- The Company incurred an inventory write-down in Q4 2020 of $15.0 million, on dried cannabis and cannabis extracts, primarily driven by cannabis product price compression in the Canadian market. The Company may incur further inventory write-downs due to pricing pressures in the marketplace.
- Adjusted EBITDA loss of $36.4 million in Q4 2020 decreased by $11.0 million from Q4 2019. The improvement year-over-year was primarily driven by a decline in gross loss, reduced sales and marketing costs and a decline in general and administrative expenses.
Full-Year 2020
- Net revenue of $37.2 million in Full-Year 2020 increased by $16.8 million from Full-Year 2019. The increase year-over-year was primarily driven by continued growth in the adult-use market in Canada and sales in the Israeli medical market. Partially offset by non-recurring wholesale revenue in the Canadian market in Full-Year 2019 and strategic price reductions on various adult-use cannabis products in Canada in Full-Year 2020.
- Gross loss of $30.0 million in Full-Year 2020 increased by $10.5 million from Full-Year 2019. The increase in losses year-over-year was primarily driven by third party purchased flower associated with adult-use products in Canada and a decline in wholesale sales in Full-Year 2020 versus Full-Year 2019. The Company anticipates that gross margin will continue to fluctuate as price and mix change from quarter-to-quarter.
- The Company incurred an inventory write-down in Full-Year 2020 of $26.1 million, on dried cannabis and cannabis extracts, primarily driven by cannabis product price compression in the Canadian market. The Company may incur further inventory write-downs due to pricing pressures in the marketplace.
- Adjusted EBITDA loss of $98.3 million in Full-Year 2020 increased by $13.5 million from Full-Year 2019. The increase in losses year-over-year was primarily driven by an increase in gross loss, increased R&D spending, increased general and administrative expenses, and higher sales and marketing costs related to brand development.
United States Results
Cronos Group’s U.S. reporting segment includes results of the Company’s operations for all brands and products in the U.S.
Fourth Quarter 2020
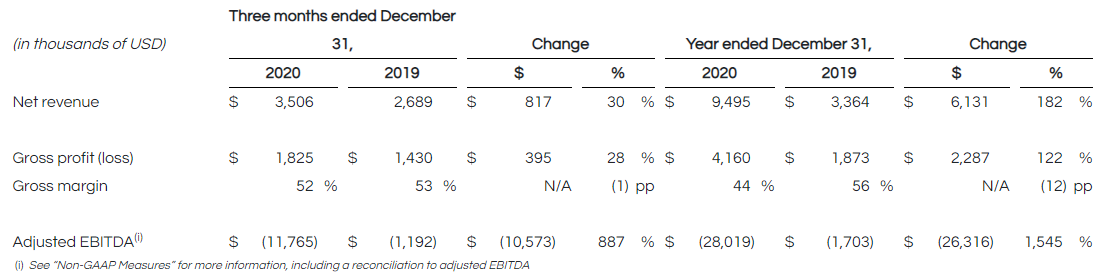
- Net revenue of $3.5 million in Q4 2020 increased by $0.8 million from Q4 2019. The increase year-over-year was primarily driven by growth in existing product lines and introductions of new hemp-derived CBD products.
- Gross profit of $1.8 million in Q4 2020 increased by $0.4 million from Q4 2019.
- Adjusted EBITDA loss of $11.8 million in Q4 2020 increased by $10.6 million from Q4 2019. The increase in losses year-over-year was primarily driven by higher sales and marketing costs related to brand development and increased general and administrative expenses.
Full-Year 2020
- Net revenue of $9.5 million in Full-Year 2020 increased by $6.1 million from Full-Year 2019. The increase year-over-year was primarily driven by a full-year of the Redwood business as opposed to 117 days in Full-Year 2019 and the growth in existing product lines and introductions of new hemp-derived CBD products. A significant amount of the U.S. Segment’s FY 2020 revenue was earned during the fourth quarter as a result of increased sales in the direct-to-consumer channel driven by holiday sales.
- Gross profit of $4.2 million in Full-Year 2020 increased by $2.3 million from Full-Year 2019.
- Adjusted EBITDA loss of $28.0 million in Full-Year 2020 increased by $26.3 million from Full-Year 2019. The increase in losses year-over-year was primarily driven by higher sales and marketing costs related to brand development and increased general and administrative expenses.
Conference Call
The Company will host a conference call and live audio webcast on Friday, February 26, 2021 at 8:30 a.m. EST to discuss 2020 fourth quarter and full-year business results and outlook. The call will last approximately one hour. An audio replay of the call will be archived on the Company’s website for replay. Instructions for the conference call are provided below:
- Live audio webcast: https://ir.thecronosgroup.com/events-presentations
- Toll Free from the U.S. and Canada dial-in: (866) 795-2258
- International dial-in: (409) 937-8902
- Conference ID: 1192729
About Cronos Group
Cronos Group is an innovative global cannabinoid company with international production and distribution across five continents. Cronos Group is committed to building disruptive intellectual property by advancing cannabis research, technology and product development. With a passion to responsibly elevate the consumer experience, Cronos Group is building an iconic brand portfolio. Cronos Group’s portfolio includes PEACE NATURALS™, a global health and wellness platform, two adult-use brands, COVE™ and Spinach™, and three hemp-derived CBD brands, Lord Jones™, Happy Dance™ and PEACE+™. For more information about Cronos Group and its brands, please visit: www.thecronosgroup.com.
Non-GAAP Measures
Cronos Group reports its financial results in accordance with Generally Accepted Accounting Principles in the U.S. (“US GAAP”). This press release refers to measures not recognized under US GAAP (“non-GAAP measures”). These non-GAAP measures do not have a standardized meaning prescribed by US GAAP and are therefore unlikely to be comparable to similar measures presented by other companies. Rather, these non-GAAP measures are provided as a supplement to corresponding US GAAP measures to provide additional information regarding our results of operations from management’s perspective. Accordingly, non-GAAP measures should not be considered a substitute for, or superior to, the financial information prepared and presented in accordance with US GAAP. All non-GAAP measures presented in this press release are reconciled to their closest reported US GAAP measure.
Adjusted EBITDA
Management reviews Adjusted EBITDA, a non-GAAP measure which excludes non-cash items or items that do not reflect management’s assessment of on-going business performance. Management defines Adjusted EBITDA as net income (loss) before interest, tax expense, depreciation and amortization adjusted for: impairment loss on goodwill and intangible assets, repurposing charges, financing and transaction costs, loss (gain) on revaluation of derivative liabilities, loss (gain) on disposal of investments, share of loss (income) from equity accounted investees, loss from discontinued operations, other loss (income), review costs related to the restatement of the Company’s 2019 interim financial statements, the Company’s responses to the reviews of such interim financial statements by various regulatory authorities and legal costs defending shareholder class action complaints brought against the Company as a result of the restatement, and share-based payments.
Management believes that Adjusted EBITDA provides the most useful insight into underlying business trends and results and provides a more meaningful comparison of year-over-year results. Management uses Adjusted EBITDA for planning, forecasting and evaluating business and financial performance, including allocating resources and evaluating results relative to employee compensation targets. As a result of the appointment of Mr. Schmidt as President and Chief Executive Officer in September 2020 and a review of how management looks at the business, Adjusted EBITDA is now the primary metric upon which management views the consolidated business performance and results year-over-year.
Adjusted EBITDA by segment
Management also reviews adjusted earnings (loss) before interest, tax, depreciation and amortization by segment (“Adjusted EBITDA by segment”), a non-GAAP measure which excludes non-cash items or items that do not reflect management’s assessment of on-going business performance. Corporate expenses are removed from Adjusted EBITDA by segment. Corporate expenses are expenses that relate to the consolidated business. The Company’s method of allocating corporate expenses is refined periodically. Management defines Adjusted EBITDA by segment as net income (loss) by segment before interest, tax expense, depreciation and amortization adjusted for the same items that are adjusted in consolidated Adjusted EBITDA.
Management believes that Adjusted EBITDA by segment provides useful insight into underlying segment trends and results and provides a more meaningful comparison of year-over-year segment results. Management uses Adjusted EBITDA by segment for planning, forecasting and evaluating business and financial performance, including allocating resources and evaluating results relative to employee compensation targets. As a result of the appointment of Mr. Schmidt as President and Chief Executive Officer in September 2020 and a review of how management looks at the business by segment, Adjusted EBITDA by segment is now the primary metric upon which management views the segment performance and results year-over-year.
Adjusted EBITDA is reconciled to net income (loss) as follows for the years ended December 31, 2020 and 2019:
Adjusted EBITDA is reconciled to net income (loss) as follows for the three months ended December 31, 2020 and 2019:
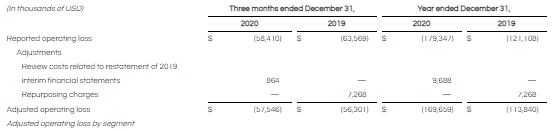
Adjusted operating loss
Management previously reviewed operating loss on an adjusted basis, which excluded certain income and expense items that management believed were not part of underlying operations. These items typically included repurposing charges and non-recurring charges such as the review costs related to the restatement of the Company’s 2019 interim financial statements, the Company’s responses to the reviews of such interim financial statements by various regulatory authorities and legal costs defending shareholder class action complaints brought against the Company as a result of the restatement.
Management did not view these items to be part of underlying results as they may have been highly variable, unusual or infrequent, were difficult to predict or could distort underlying business trends and results. Management believed that adjusted operating loss provided useful insight into underlying business trends and results and provided a more meaningful comparison of year-over-year results. Management used to use adjusted operating loss for planning, forecasting and evaluating business and financial performance, including allocating resources and evaluating results relative to employee compensation targets. As a result of the appointment of Mr. Schmidt as President and Chief Executive Officer in September 2020 and a review of how management looks at the business, adjusted operating loss is no longer a primary metric upon which management views the consolidated business performance and results year-over-year.
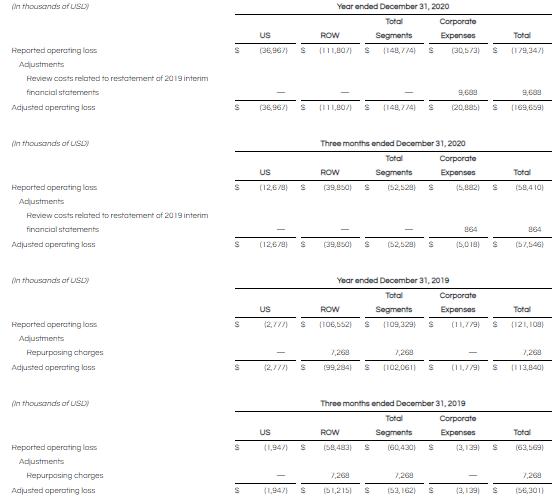
Management previously reviewed operating loss by segment, which excluded corporate expenses, and adjusted operating loss by segment, which further excluded certain income and expense items that management believed were not part of the underlying segment’s operations. Corporate expenses were expenses that relate to the consolidated business and not to an individual operating segment while the income and expense items typically included non-recurring charges such as repurposing charges and review costs related to the restatement of the Company’s 2019 interim financial statements, the Company’s responses to the reviews of such interim financial statements by various regulatory authorities and legal costs defending shareholder class action complaints brought against the Company as a result of the restatement. Management did not view the income and expense items above to be part of underlying results of the segment as they may have been highly variable, unusual or infrequent, were difficult to predict and could distort underlying business trends and results. As a result of the appointment of Mr. Schmidt as President and Chief Executive Officer in September 2020 and a review of how management looks at the business, adjusted operating loss by segment is no longer the primary metric upon which management views the segment performance and results year-over-year.
Review costs related to restatement of 2019 interim financial statements
For FY 2020, the Company reported review costs related to the restatement of 2019 interim financial statements of $9.7 million (Q4 2020: $0.9 million) within the general and administrative line in the consolidated statements of net Income (loss). These financial statement review costs include costs related to the restatement of the Company’s 2019 interim financial statements, costs related to the Company’s responses to requests for information from various regulatory authorities relating to such restatement and legal costs defending shareholder class action complaints brought against the Company as a result of the restatement. There were no costs related to the restatement of the Company’s 2019 interim financial statement incurred during the year ended December 31, 2019.
Repurposing charges
For Q4 2019 and FY 2019, the Company reported pre-tax charges of $7.3 million related to the Company’s decision to redesign its efforts at the Peace Naturals Campus, which includes impairment costs, inventory write-down, and employee termination benefits. There were no repurposing costs incurred during FY 2020.
Interest income, net
For FY 2020, the Company reported interest income, net of $18.4 million, representing a decrease of $9.6 million from FY 2019 primarily due to the impact of a decrease in interest rates on cash and cash equivalents and short-term investments during FY 2020 compared to FY 2019.
For Q4 2020, the Company reported interest income, net of $3.1 million, representing a decrease of $4.4 million from Q4 2019 primarily due to the impact of a decrease in interest rates on cash and cash equivalents and short-term investments during Q4 2020 compared to Q4 2019.
Gain on revaluation of derivative liabilities
For FY 2020, the Company reported a gain on revaluation of derivative liabilities of $129.3 million representing a decrease of $1,147.6 million from FY 2019 primarily driven by a decrease in the Company’s share price since December 31, 2019. The Company expects continued changes in derivative valuations as the Company’s share price fluctuates period-to-period. For further information, see Note 14 to the consolidated financial statements in Item 8 of the Company’s Annual Report on Form 10-K.
For Q4 2020, the Company reported a loss on revaluation of derivative liabilities of $53.5 million representing a decrease of $172.4 million from Q4 2019 primarily driven by a decrease in the Company’s share price since December 31, 2019. The Company expects continued changes in derivative valuations as the Company’s share price fluctuates period-to-period. For further information, see Note 14 to the consolidated financial statements in Item 8 of the Company’s Annual Report on Form 10-K.
Impairment loss on goodwill and intangible assets
For FY 2020, the Company reported an impairment loss on goodwill and intangible assets of $40.0 million representing an increase of $40.0 million from FY 2019 primarily driven by a $35.0 million impairment charge on the U.S. reporting unit and a $5.0 million impairment charge on the Lord Jones™ brand during the year ended December 31, 2020. For further information, see Note 11 to the consolidated financial statements in Item 8 of the Company’s Annual Report on Form 10-K.
For Q4 2020 and Q4 2019, no impairment loss was recorded on goodwill and intangible assets.
Gain on disposal of other investments
For FY 2020, the Company reported a gain on disposal of other investments of $4.8 million representing a decrease of $11.5 million from FY 2019 primarily driven by a decrease in the sale of shares associated with the Whistler Transaction (as defined below) during FY 2020 compared to FY 2019. For further information, see Note 7 to the consolidated financial statements in Item 8 of the Company’s Annual Report on Form 10-K.
For Q4 2020 and Q4 2019, the increase in gain on disposal of other investments did not materially impact the comparability of net income (loss).
Financing and transaction costs
For FY 2020, the Company reported financing and transaction costs of $0.04 million representing a decrease of $32.2 million from FY 2019 primarily driven by the increased financing and transaction costs incurred in FY 2019 compared to FY 2020 as a result of the Altria Investment and the Redwood Acquisition. For further information, see Note 27 and Note 14 to the consolidated financial statements in Item 8 of the Company’s Annual Report on Form 10-K.
For Q4 2020, the Company reported no financing and transaction costs representing a decrease of $0.5 million from Q4 2019.
Income tax expense
For FY 2020, the Company reported an income tax expense of $1.3 million representing an increase of $1.3 million from FY 2019 primarily driven by changes in valuation allowance partially offset by a decrease in the fair value gain on financial liabilities.
For Q4 2020, the Company reported an income tax expense of $0.4 million representing an increase of $0.4 million from FY 2019 primarily driven by changes in valuation allowance and a decrease in the fair value gain on financial liabilities.
Foreign currency exchange rates
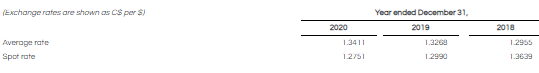
All currency amounts in this press release are stated in U.S. dollars (“USD”), which is our reporting currency, unless otherwise noted. All references to “dollars” or “$” are to USD. The assets and liabilities of the Company’s foreign operations are translated into dollars at the exchange rate in effect as of December 31, 2020, December 31, 2019 and December 31, 2018 as reported on Bloomberg. Transactions affecting shareholders’ equity are translated at historical foreign exchange rates. The consolidated statements of net income (loss) and comprehensive income (loss) and the consolidated statements of cash flows of the Company’s foreign operations are translated into USD by applying the average foreign exchange rate in effect for the reporting period as reported on Bloomberg.
The exchange rates used to translate from USD to Canadian dollars (“C$”) is shown below: