![]()
Surna Reports Q3 2018 Results
BOULDER, Colorado , Nov. 14, 2018 /PRNewswire/ — Surna Inc. (OTCQB: SRNA) announced today operating and financial results for the three and nine months ended September 30, 2018. Surna designs, engineers and manufactures application-specific environmental control and air sanitation systems for commercial, state- and provincial-regulated indoor cannabis cultivation facilities in the U.S. and Canada.
Q3 2018 versus Q2 2018 Highlights
Key highlights comparing Q3 2018 to Q2 2018 are set forth below. Additionally, our condensed financial statements for the three and nine months ending September 30, 2018 are included at the end of this press release.
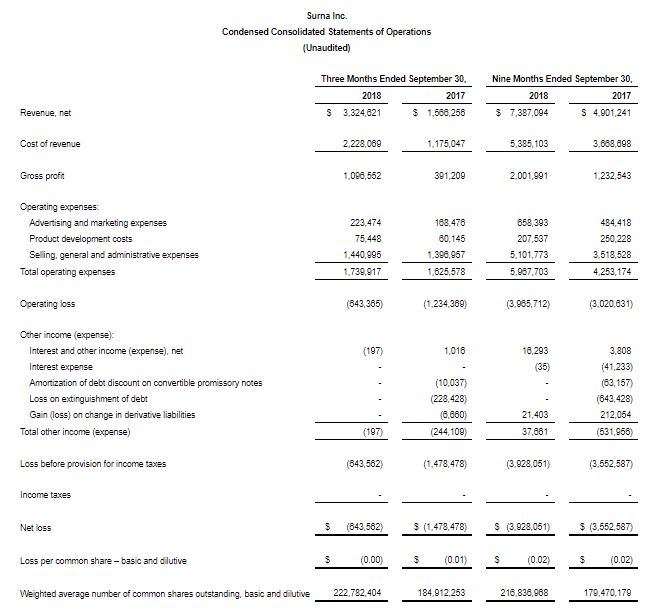
- Our Q3 2018 revenue was $3,325,000, an increase of $1,317,000, or 66%, compared to Q2 2018.
- Our Q3 2018 net bookings were $3,328,000, a decrease of $539,000, or 14% compared to Q2 2018. See ‘Sales Activity and Backlog’ below
- Our ending backlog as of September 30, 2018 was $8,886,000, an increase of $3,000, or 1%, compared to our June 30, 2018 backlog.
- Our Q3 2018 gross profit margin was 33%, an increase of seven percentage points from our Q2 2018 gross profit margin.
- We realized a Q3 2018 net loss of $644,000 as compared to a Q2 2018 net loss of $1,401,000, a decrease of $757,000, or 54%. The Q3 2018 net loss included $574,000 of non-cash, stock-based compensation expenses and $48,000 of depreciation and intangible asset amortization expense as compared to $823,000 of non-cash, stock-based compensation expenses and $44,000 of depreciation and intangible asset amortization expense in Q2 2018. Excluding these non-cash items, our net loss was $22,000, a decrease $512,000 or 96%.
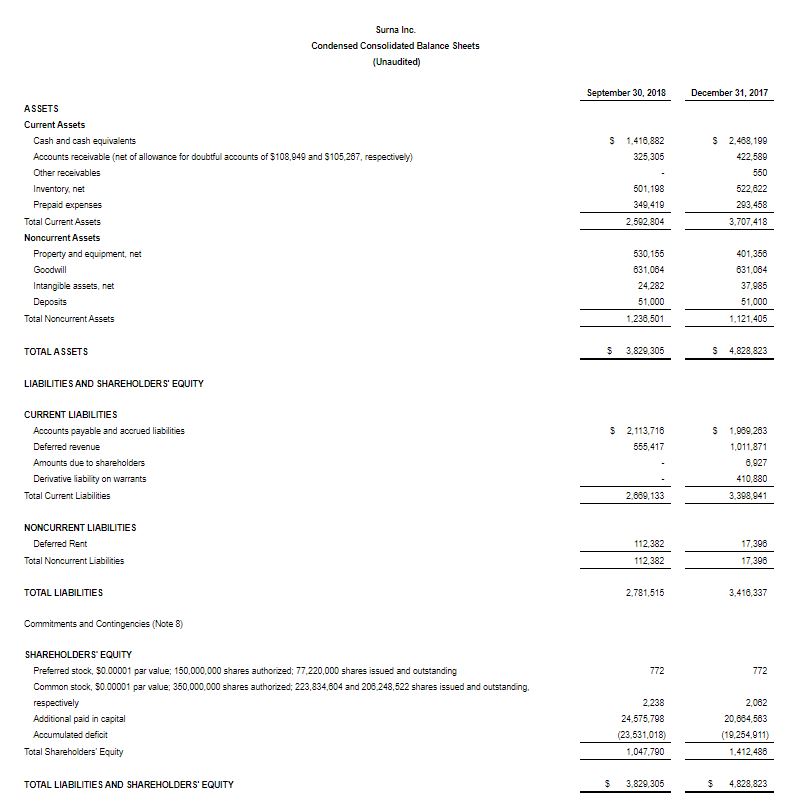
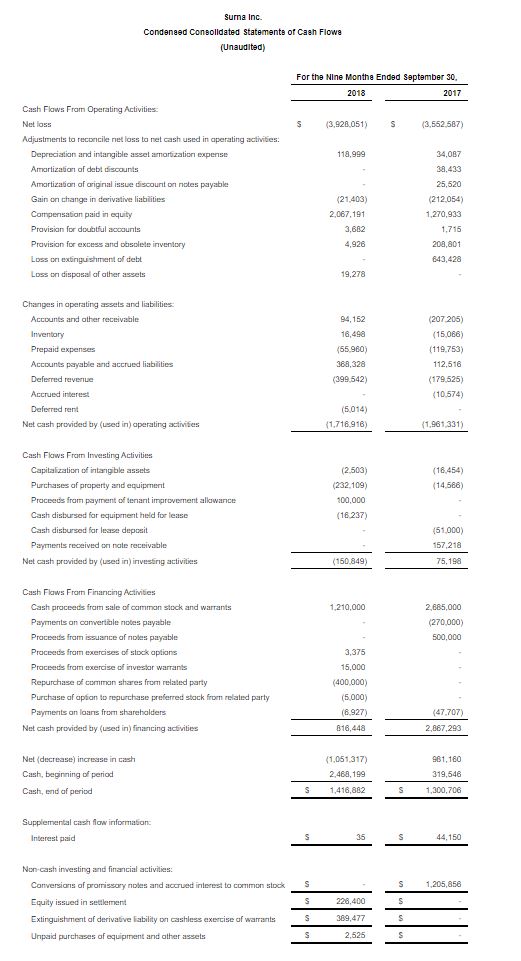
- As of September 30, 2018, we had cash and cash equivalents of $1,417,000, compared to cash and cash equivalents of $1,629,000 as of June 30, 2018, a decrease of $212,000, or 13%.
Our current management team was put in place just over a year ago with a primary objective of increasing revenue, improving operations and creating a visible path to sustained profitability. Q3 2018 marked the first quarter where the fruits of these efforts became visible across three of the Company’s key operating metrics:
1. Revenue. Q3 2018 reflects a positive revenue-generating capability. Although, for a variety of reasons typical to most small businesses, it is certain that revenue will continue to be uneven in future quarters, management believes that the trend will continue and improve over time.
2. Margins. The seven-percentage point increase in gross margin to 33% in Q3 2018 demonstrates the Company’s capability of improving margins contemporaneous with increasing revenue growth—rather than sacrificing one for the other, as is sometimes the case for businesses seeking to ramp revenue.
3. Cash. The net loss, excluding non-cash, stock-based compensation, depreciation, and amortization expenses, of only $22,000 in Q3 2018 demonstrates the Company’s ability to conserve cash as our revenue level increases. As with the uncertainty surrounding revenue and changes in revenue from quarter to quarter, the Company also cannot accurately forecast whether it will generate or use cash over the next few quarters. Nonetheless, the Company remains highly focused on its cash balance as a key operating metric.
While we realize that one quarter is just that and the Company still has losses, Q3 2018 was nonetheless a gratifying validation of the foundation that we have established and the operational improvements that have been implemented across every aspect of Surna’s business over the last four quarters. If and when Surna achieves sustained positive cash flow over a number of quarters, we believe that proof point will be a significant differentiating factor in our industry and correspondingly open up a wide range of strategic opportunities that may not otherwise be available to us or other companies consuming cash in our industry.
 Chris Bechtel, the Company’s CEO
We further believe that cash flow positive companies in our industry have the ability to maximize the visibility, liquidity and marketability of their public shares and build shareholder value. Surna is working toward being one of those companies.
Year-to-Date Highlights
- Revenue for the nine months ended September 30, 2018 was $7,387,000 compared to $4,901,000 for the nine months ended September 30, 2017, an increase of $2,486,000, or 51%.
- We had a net loss of $3,928,000 for the nine months ended September 30, 2018, as compared to a net loss of $3,553,000 for the nine months ended September 30, 2017, an increase of $375,000, or 11%. However, the net loss included $2,067,000 of non-cash, stock-based compensation expenses and $119,000 of depreciation and intangible asset amortization expense in the nine months ended September 30, 2018 as compared to non-cash, stock-based compensation expense of $1,271,000 and depreciation and intangible asset amortization expense of $34,000 in the nine months ended September 30, 2017. Excluding these non-cash items, our net loss was $1,742,000, a decrease of $506,000 or 23%.
Sales Activity and Backlog
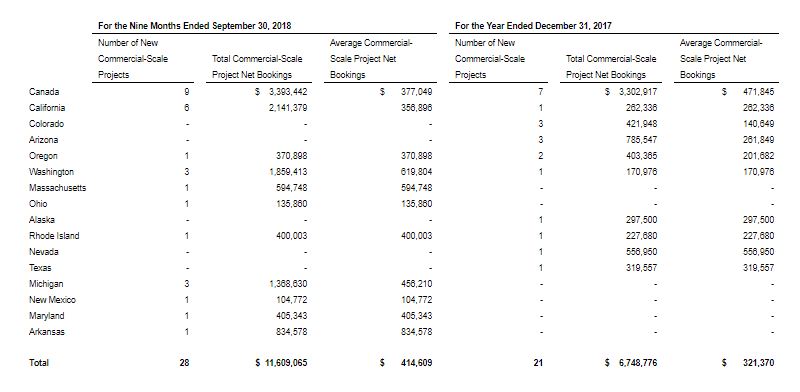
During the nine months ended September 30, 2018, we entered into sales orders for 28 projects, each with a sales value over $100,000, which we refer to as commercial-scale projects. These commercial-scale projects represented aggregate net bookings of $11,609,000 for the nine months ended September 30, 2018, or an average of $415,000. This compares to 21 commercial-scale projects representing aggregate net bookings of $6,749,000 for the entire 2017 year, or an average of $321,000.
The following table sets forth our net bookings of commercial-scale projects for each cohort period presented (meaning, the commercial-scale contracts executed during each period for which we received an initial deposit, adjusted for any change orders or cancellations for that cohort group to date) by country/state.
The following table sets forth: (i) our beginning backlog (the remaining contract value of outstanding sales contracts for which we have received an initial deposit as of the previous period), (ii) our net bookings for the period (new sales contracts executed during the period for which we received an initial deposit, net of any adjustments including change orders during the period), (iii) our recognized revenue for the period, and (iv) our ending backlog for the period (the sum of the beginning backlog and net bookings, less recognized revenue).
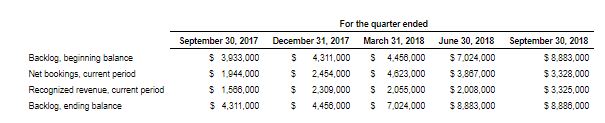
We believe net bookings in any given cohort quarter are our best leading indicator of revenue that we may recognize in the ensuing two to eight quarters from that cohort. However, our backlog includes projects for which we have only received an initial deposit and, as a result, there are potential risks that the equipment portion of these projects will not be completed or will be delayed.
About Surna Inc.
Surna Inc. (www.surna.com) designs, engineers and manufactures application-specific environmental control and air sanitation systems for commercial, state- and provincial-regulated indoor cannabis cultivation facilities in the U.S. and Canada. Our engineering and technical team provides energy and water efficient solutions that allow growers to meet the unique demands of a cannabis cultivation environment through precise temperature, humidity, light, and process controls and to satisfy the evolving code and regulatory requirements being imposed at the state and local levels.
Headquartered in Boulder, Colorado, we leverage our experience in this space in order to bring value-added climate control solutions to our customers that help improve their overall crop quality and yield as well as optimize the resource efficiency of their controlled environment (i.e., indoor and greenhouses) cultivation facilities. We have been involved in consulting, equipment sales and/or full-scale design for over 700 grow facilities since 2006 making us a trusted resource for indoor environmental design and control management for the cannabis industry.
Our customers have included small cultivation operations to licensed commercial facilities ranging from several thousand to more than 100,000 square feet. We have sold our equipment and systems throughout the U.S. and Canada as well as internationally in South Africa, Switzerland and the United Kingdom. Our revenue stream is derived primarily from supplying mechanical engineering services and climate and environmental control equipment to commercial indoor cannabis grow facilities. We also sell equipment to smaller cultivators who can purchase either directly from us, or from our authorized wholesalers or retailers. Though our customers do, we neither produce nor sell cannabis.