![]()
Turning Point Brands Announces Second Quarter 2022 Results
Stoker’s continues to gain share with Zig-Zag’s US rolling papers and e-commerce subsegment recording another quarter of double digit growth
LOUISVILLE, Ky.–(BUSINESS WIRE)– Turning Point Brands, Inc. (“TPB” or “the Company”) (NYSE: TPB), a manufacturer, marketer and distributor of branded consumer products, including alternative smoking accessories and consumables with active ingredients, announced today financial results for the second quarter ended June 30, 2022.
Q2 2022 vs. Q2 2021
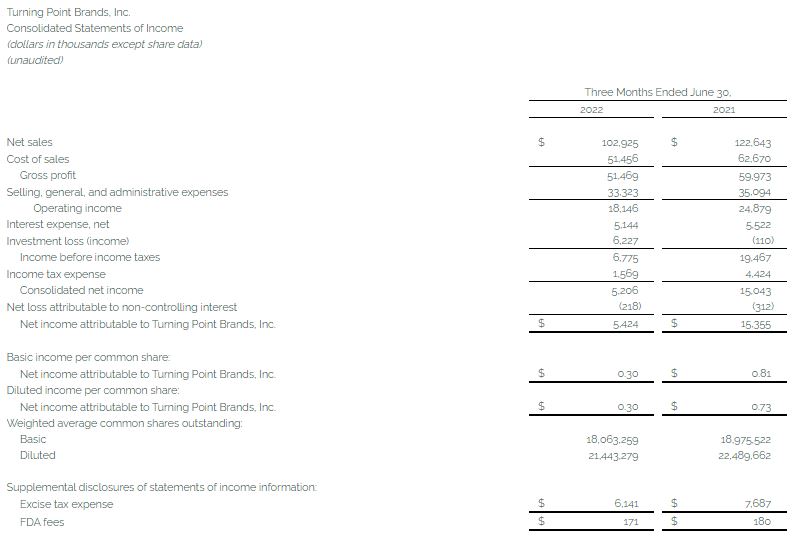
- Net sales decreased 16.1 percent to $102.9 million
- Combined net sales for Zig-Zag and Stoker’s Products demonstrated resilience decreasing 0.9 percent for the quarter
- NewGen net sales declined by 45.1 percent (declined 2.1 percent sequentially)
- Gross profit decreased 14.2 percent to $51.5 million
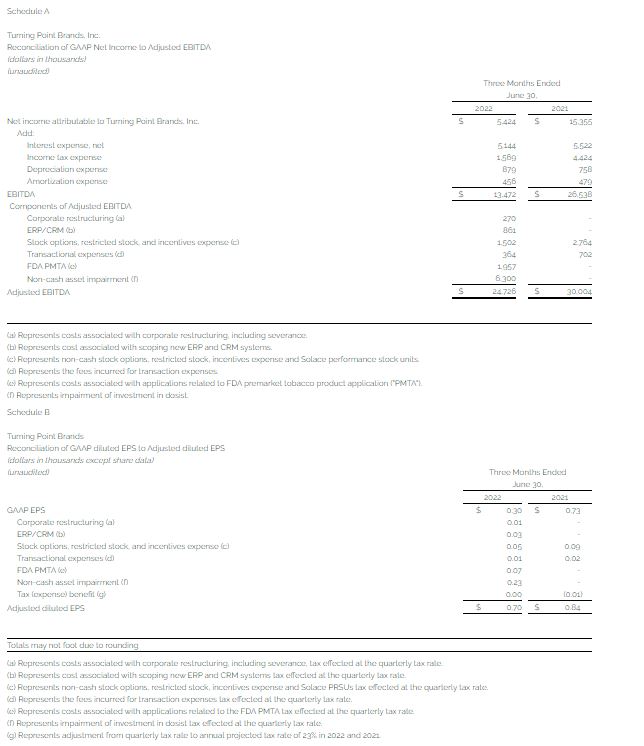
- Net income decreased 64.7 percent to $5.4 million
- Adjusted EBITDA decreased 17.6 percent to $24.7 million (see Schedule A for a reconciliation to net income)
- Diluted EPS of $0.30 and Adjusted Diluted EPS of $0.70 as compared to $0.73 and $0.84 in the same period one year ago, respectively (see Schedule B for a reconciliation to Diluted EPS)
“We are pleased with the stable performance of both the Zig-Zag and Stoker’s segments during the quarter in light of a heightened inflationary environment for our customers with rising prices at the pump impacting consumer traffic in convenience stores. While overall sales decreased 16 percent from the previous year, Zig-Zag and Stoker’s sales were steady despite weakness in the wraps and loose leaf subsegments. Zig-Zag maintained its leading positions in both the roll-your-own paper and cigar wraps markets while Stoker’s MST experienced accelerated share gains driven by consumer trade-down to the value category.”
Despite NewGen revenue decreasing 45 percent from last year, the segment remained relatively stable from the previous quarter and profitable as we continue to monitor FDA regulatory developments.
 Yavor Efremov, President and CEO
We continued to deploy a substantial amount of our free cash flow towards share repurchases during the quarter while maintaining a strong balance sheet providing us with optionality on further capital deployment.
Mr. Efremov concluded, “Going forward, we maintain a favorable outlook on our underlying business and our competitive positioning. However, given the market environment during the second quarter, along with continued inflationary pressures and resulting uncertainty of consumer confidence, we feel it is prudent to adjust our outlook for the year.”
Zig-Zag Products Segment (45 percent of total net sales in the quarter)
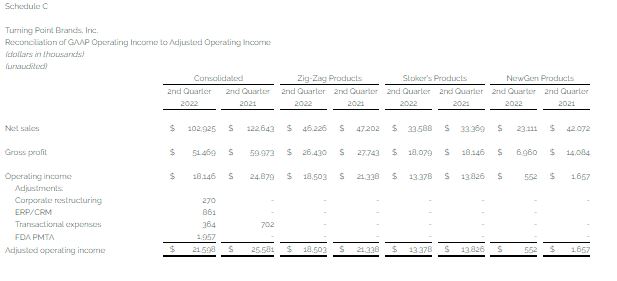
For the second quarter, Zig-Zag Products remained broadly in-line with a record performance in 2021 with net sales decreasing 2.1 percent to $46.2 million against a tough comparable period when sales increased 72.3 percent in the prior year period. TPB’s U.S. rolling papers and e-commerce business, and its Canadian business both grew double-digits. However, this was offset by a decline in the cigar wraps business driven partially by a trade inventory reduction during the current period compared against a trade inventory load in the prior year period. Wild Hemp sales moved into the Zig-Zag Products segment during the current year period, which contributed $0.2 million, or 0.4 percent to segment sales. For the second quarter, total Zig-Zag Products segment volume decreased 2.3 percent, while price / mix increased 0.2 percent.
For the quarter, the Zig-Zag Products segment gross profit decreased 4.7 percent to $26.4 million. The segment’s gross margin declined 160 basis points to 57.2 percent driven primarily by strong growth in lower gross margin products.
“Paper cones and Zig-Zag’s e-commerce business once again drove the growth within our U.S. papers business,” said Graham Purdy, Chief Operating Officer. “Our wraps business saw a double-digit decline due to a tough comparable against a trade inventory load in the prior year period. We are excited to have recently launched distribution of CLIPPER lighters which we expect to ramp up through the second half of the year.”
Stoker’s Products Segment (33 percent of total net sales in the quarter)
For the second quarter, Stoker’s Products net sales increased 0.7 percent to $33.6 million. MST grew mid-single digits but was offset by a decline in loose-leaf chewing tobacco. MST represented 65 percent of Stoker’s Products revenues in the quarter, up from 62 percent a year earlier. FRE nicotine pouch products’ sales moved into the Stoker’s Products segment during the current year period and contributed $0.2 million or 0.5 percent to segment sales. For the second quarter, total Stoker’s Products segment volume decreased 6.1 percent, while price / mix increased 6.8 percent.
For the quarter, the Stoker’s Products segment gross profit decreased 0.4 percent to $18.1 million. The segment’s gross margin contracted 60 basis points to 53.8 percent due to an inventory write-down of certain FRE products due to rationalization of the product line ahead of the regulatory filing deadline. The segment’s gross margin expanded 80 basis points excluding FRE.
“Stoker’s continued to outperform the market with share gains in both the MST and loose-leaf chewing tobacco categories during the quarter,” continued Purdy. “With the current inflationary environment accelerating the secular down-trading trends in the industry, Stoker’s remains well positioned within its categories as a leading value brand.”
NewGen Products Segment (22 percent of total net sales in the quarter)
For the second quarter, NewGen Products net sales decreased 45.1 percent to $23.1 million. The regulatory environment for the vape businesses continues to impact sales.
For the quarter, the NewGen Products segment gross profit decreased 50.6 percent to $7.0 million. The segment gross margin contracted 340 basis points from the previous year to 30.1 percent due to product mix and the competitive environment.
“Despite another challenging quarter further impacted by new regulation around synthetic nicotine products, our vape business remained profitable,” concluded Purdy. “Meanwhile, our distribution capabilities continued to improve through the quarter as we position our business for a post-PMTA environment while our vapor products’ applications remain under FDA review.”
Performance Measures in the Second Quarter
Second quarter consolidated selling, general and administrative (“SG&A”) expenses were $33.3 million compared to $35.1 million in the second quarter of 2021.
The second quarter SG&A included the following notable items:
- $0.3 million of restructuring expenses compared to none in the previous year
- $0.9 million of ERP / CRM scoping expenses and duplicative system costs compared to none in the previous year
- $1.5 million of stock options, restricted stock and incentive expense compared to $2.8 million in the year-ago period
- $0.4 million of transaction expenses compared to $0.7 million in the year-ago period
- $2.0 million of FDA PMTA-related expenses compared to $0.6 million in the year-ago period
- $1.6 million from the accounting consolidation of Turning Point Brands Canada compared to $1.1 in the year-ago period with the increase driven by the inclusion of a full quarter of the DVW acquisition in the current period
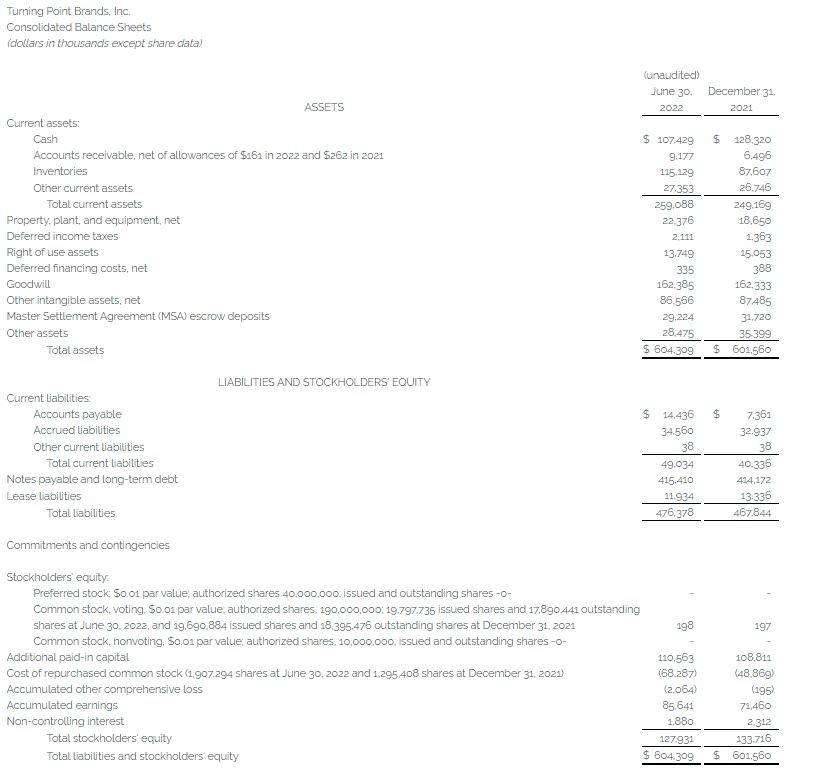
Total gross debt as of June 30, 2022 was $422.5 million. The corresponding net debt (total gross debt less cash) at June 30, 2022 was $315.1 million. The Company ended the quarter with total liquidity of $128.8 million, comprised of $107.4 million in cash and $21.4 million of revolving credit facility capacity.
During the quarter, the Company spent $8.8 million to repurchase 301,662 shares at an average price of $29.16 per share. The Company also recorded an additional impairment of $6.3 million during the quarter related to its investment in dosist.
2022 Outlook
Due to the uncertain macro environment and slower than expected improvement in our NewGen Products segment, the Company now expects the following full-year 2022 results:
- Zig-Zag Products sales of $193 to $200 million (compared to previous outlook of $193 to $203 million)
- Stoker’s Products sales of $127 to $133 million
- Consolidated adjusted EBITDA of $97 to $103 million
Earnings Conference Call
As previously disclosed, a conference call with the investment community to review TPB’s financial results has been scheduled for 8:30 a.m. Eastern on Wednesday, July 27, 2022. Investment community participants should dial in 10 minutes ahead of time using the toll-free number 888-330-2502 (international participants should call 240-789-2713), and follow the audio prompts after typing in the event ID: 6640134. A live listen-only webcast of the call will be available on the Events and Presentations section of the investor relations portion of the Company website (www.turningpointbrands.com). A replay of the webcast will be available on the site two hours following the call.
Non-GAAP Financial Measures
In addition to financial measures prepared in accordance with generally accepted accounting principles in the United States (GAAP), this press release includes certain non-GAAP financial measures including EBITDA, Adjusted EBITDA, Adjusted diluted EPS and Adjusted Operating Income. A reconciliation of these non-GAAP financial measures accompanies this release.
About Turning Point Brands, Inc.
Turning Point Brands (NYSE: TPB) is a manufacturer, marketer and distributor of branded consumer products including alternative smoking accessories and consumables with active ingredients through its iconic Zig-Zag® and Stoker’s® brands, and its emerging brands within the NewGen segment. TPB’s products are available in more than 215,000 retail outlets in North America, and on sites such as www.zigzag.com and www.solacevapor.com. For the latest news and information about TPB and its brands, please visit www.turningpointbrands.com.

Non-GAAP Financial Measures
To supplement our financial information presented in accordance with generally accepted accounting principles in the United States, or U.S. GAAP, we use non-U.S. GAAP financial measures, including EBITDA, Adjusted EBITDA, Adjusted diluted EPS, and Adjusted Operating Income. We believe Adjusted EBITDA provides useful information to management and investors regarding certain financial and business trends relating to our financial condition and results of operations. Adjusted EBITDA, Adjusted diluted EPS, and Adjusted Operating Income are used by management to compare our performance to that of prior periods for trend analyses and planning purposes and are presented to our board of directors. We believe that EBITDA, Adjusted EBITDA, Adjusted diluted EPS and Adjusted Operating Income are appropriate measures of operating performance because they eliminate the impact of expenses that do not relate to business performance.
We define “EBITDA” as net income before interest expense, loss on extinguishment of debt, provision for income taxes, depreciation and amortization. We define “Adjusted EBITDA” as net income before interest expense, loss on extinguishment of debt, provision for income taxes, depreciation, amortization, other non-cash items and other items that we do not consider ordinary course in our evaluation of ongoing operating performance. We define “Adjusted diluted EPS” as diluted earnings per share excluding items that we do not consider ordinary course in our evaluation of ongoing operating performance. We define “Adjusted Operating Income” as operating income excluding other non-cash items and other items that we do not consider ordinary course in our evaluation of ongoing operating performance.
Non-U.S. GAAP measures should not be considered a substitute for, or superior to, financial measures calculated in accordance with U.S. GAAP. EBITDA, Adjusted EBITDA Adjusted diluted EPS and Adjusted Operating Income exclude significant expenses that are required by U.S. GAAP to be recorded in our financial statements and is subject to inherent limitations. In addition, other companies in our industry may calculate this non-U.S. GAAP measure differently than we do or may not calculate it at all, limiting its usefulness as a comparative measure.
In accordance with SEC rules, we have provided, in the supplemental information attached, a reconciliation of the non-GAAP measures to the next directly comparable GAAP measures.